
Cardano Price Forecast: ADA steadies amid Midnight and Google Cloud union
- Cardano holds above $0.80 on Wednesday following a recovery in Tuesday’s session of nearly 2%, erasing intraday losses.
- Midnight Network announced a collaboration with Google Cloud to boost privacy-first and zero-knowledge digital systems.
- On-chain data show a spike in the percentage of total supply in profit as investors slow down harvesting gains.
Cardano (ADA) trades above $0.8000 at the time of writing on Wednesday, facing opposition from the 100-day Exponential Moving Average (EMA). The altcoin remains steady as a result of its partnership with Google Cloud, which aims to enhance a privacy-first and zero-knowledge digital system. Furthermore, the on-chain data suggest a decline in selling pressure as ADA supply in profit increases.
Midnight Network secures Google Cloud partnership
Midnight announced its partnership with Google Cloud on Tuesday to accelerate its digital infrastructure. Apart from the network infrastructure, Google Cloud will provide Confidential Computing and Mandiant threat monitoring services, and extend support to developers with $200,000 in credit via the Google for Startups Web3 program.
In collaboration with Google Cloud, the Cardano ecosystem may experience a renewed interest from developers to build more applications catering to retail and corporate clients.

On-chain data signals a decline in selling pressure
Amid the new partnership, Santiment data shows a decline in selling pressure. The Network Realized Profit/Loss (NRPL) at 1.53 million ADA, down from 33.71 million ADA on Tuesday, indicates a significant decline in profit-taking, which limits the risk of immediate overhead supply.
Validating the low selling pressure, the percentage of total supply in profit stands at 69.69%, up from the weekly low of 63.63% on Friday.
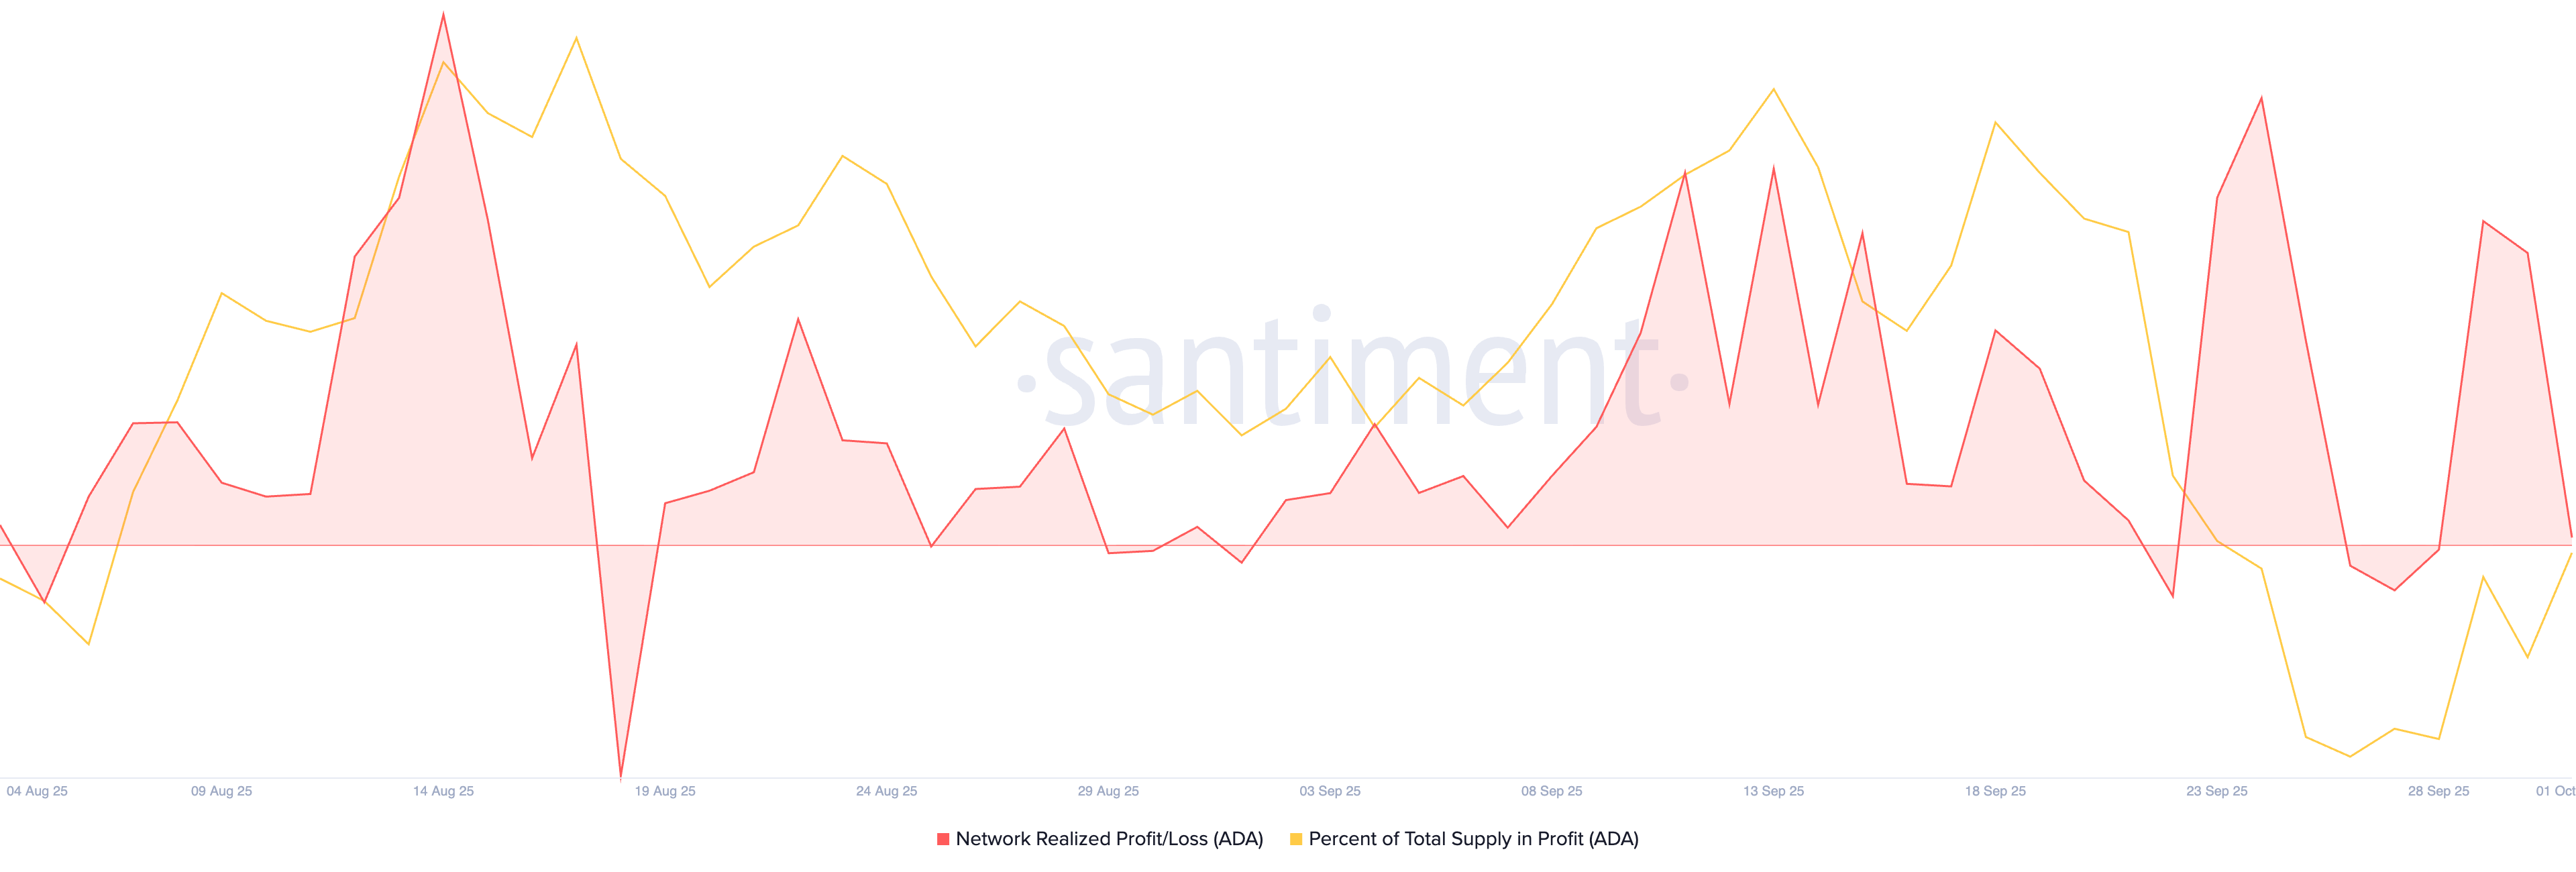
Cardano's network realized profit/loss. Source: Santiment
Cardano stands on the verge of a potential rally
Cardano holds near the 100-day EMA at $0.8055 following a Doji candle formation on Tuesday, which represents a recovery from the 2% intraday loss with the Google Cloud partnership announcement. This extends the consolidation period to the third day following the 3.55% rise on Sunday.
The momentum indicators on the daily chart corroborate the waning selling pressure as the Relative Strength Index (RSI) moves flat at 43 after a reversal from above the oversold zone. Additionally, the Moving Average Convergence Divergence (MACD) is moving closer to its signal line, indicating a potential crossover, which would confirm a bullish shift in trend momentum.
If an uptrend develops in ADA, the key resistance levels are the 50% retracement level at $0.9182, based on the range between the December 3 swing high at $1.3264 and the June 22 swing low at $0.5100, and the 61.8% Fibonacci retracement at $1.0145.
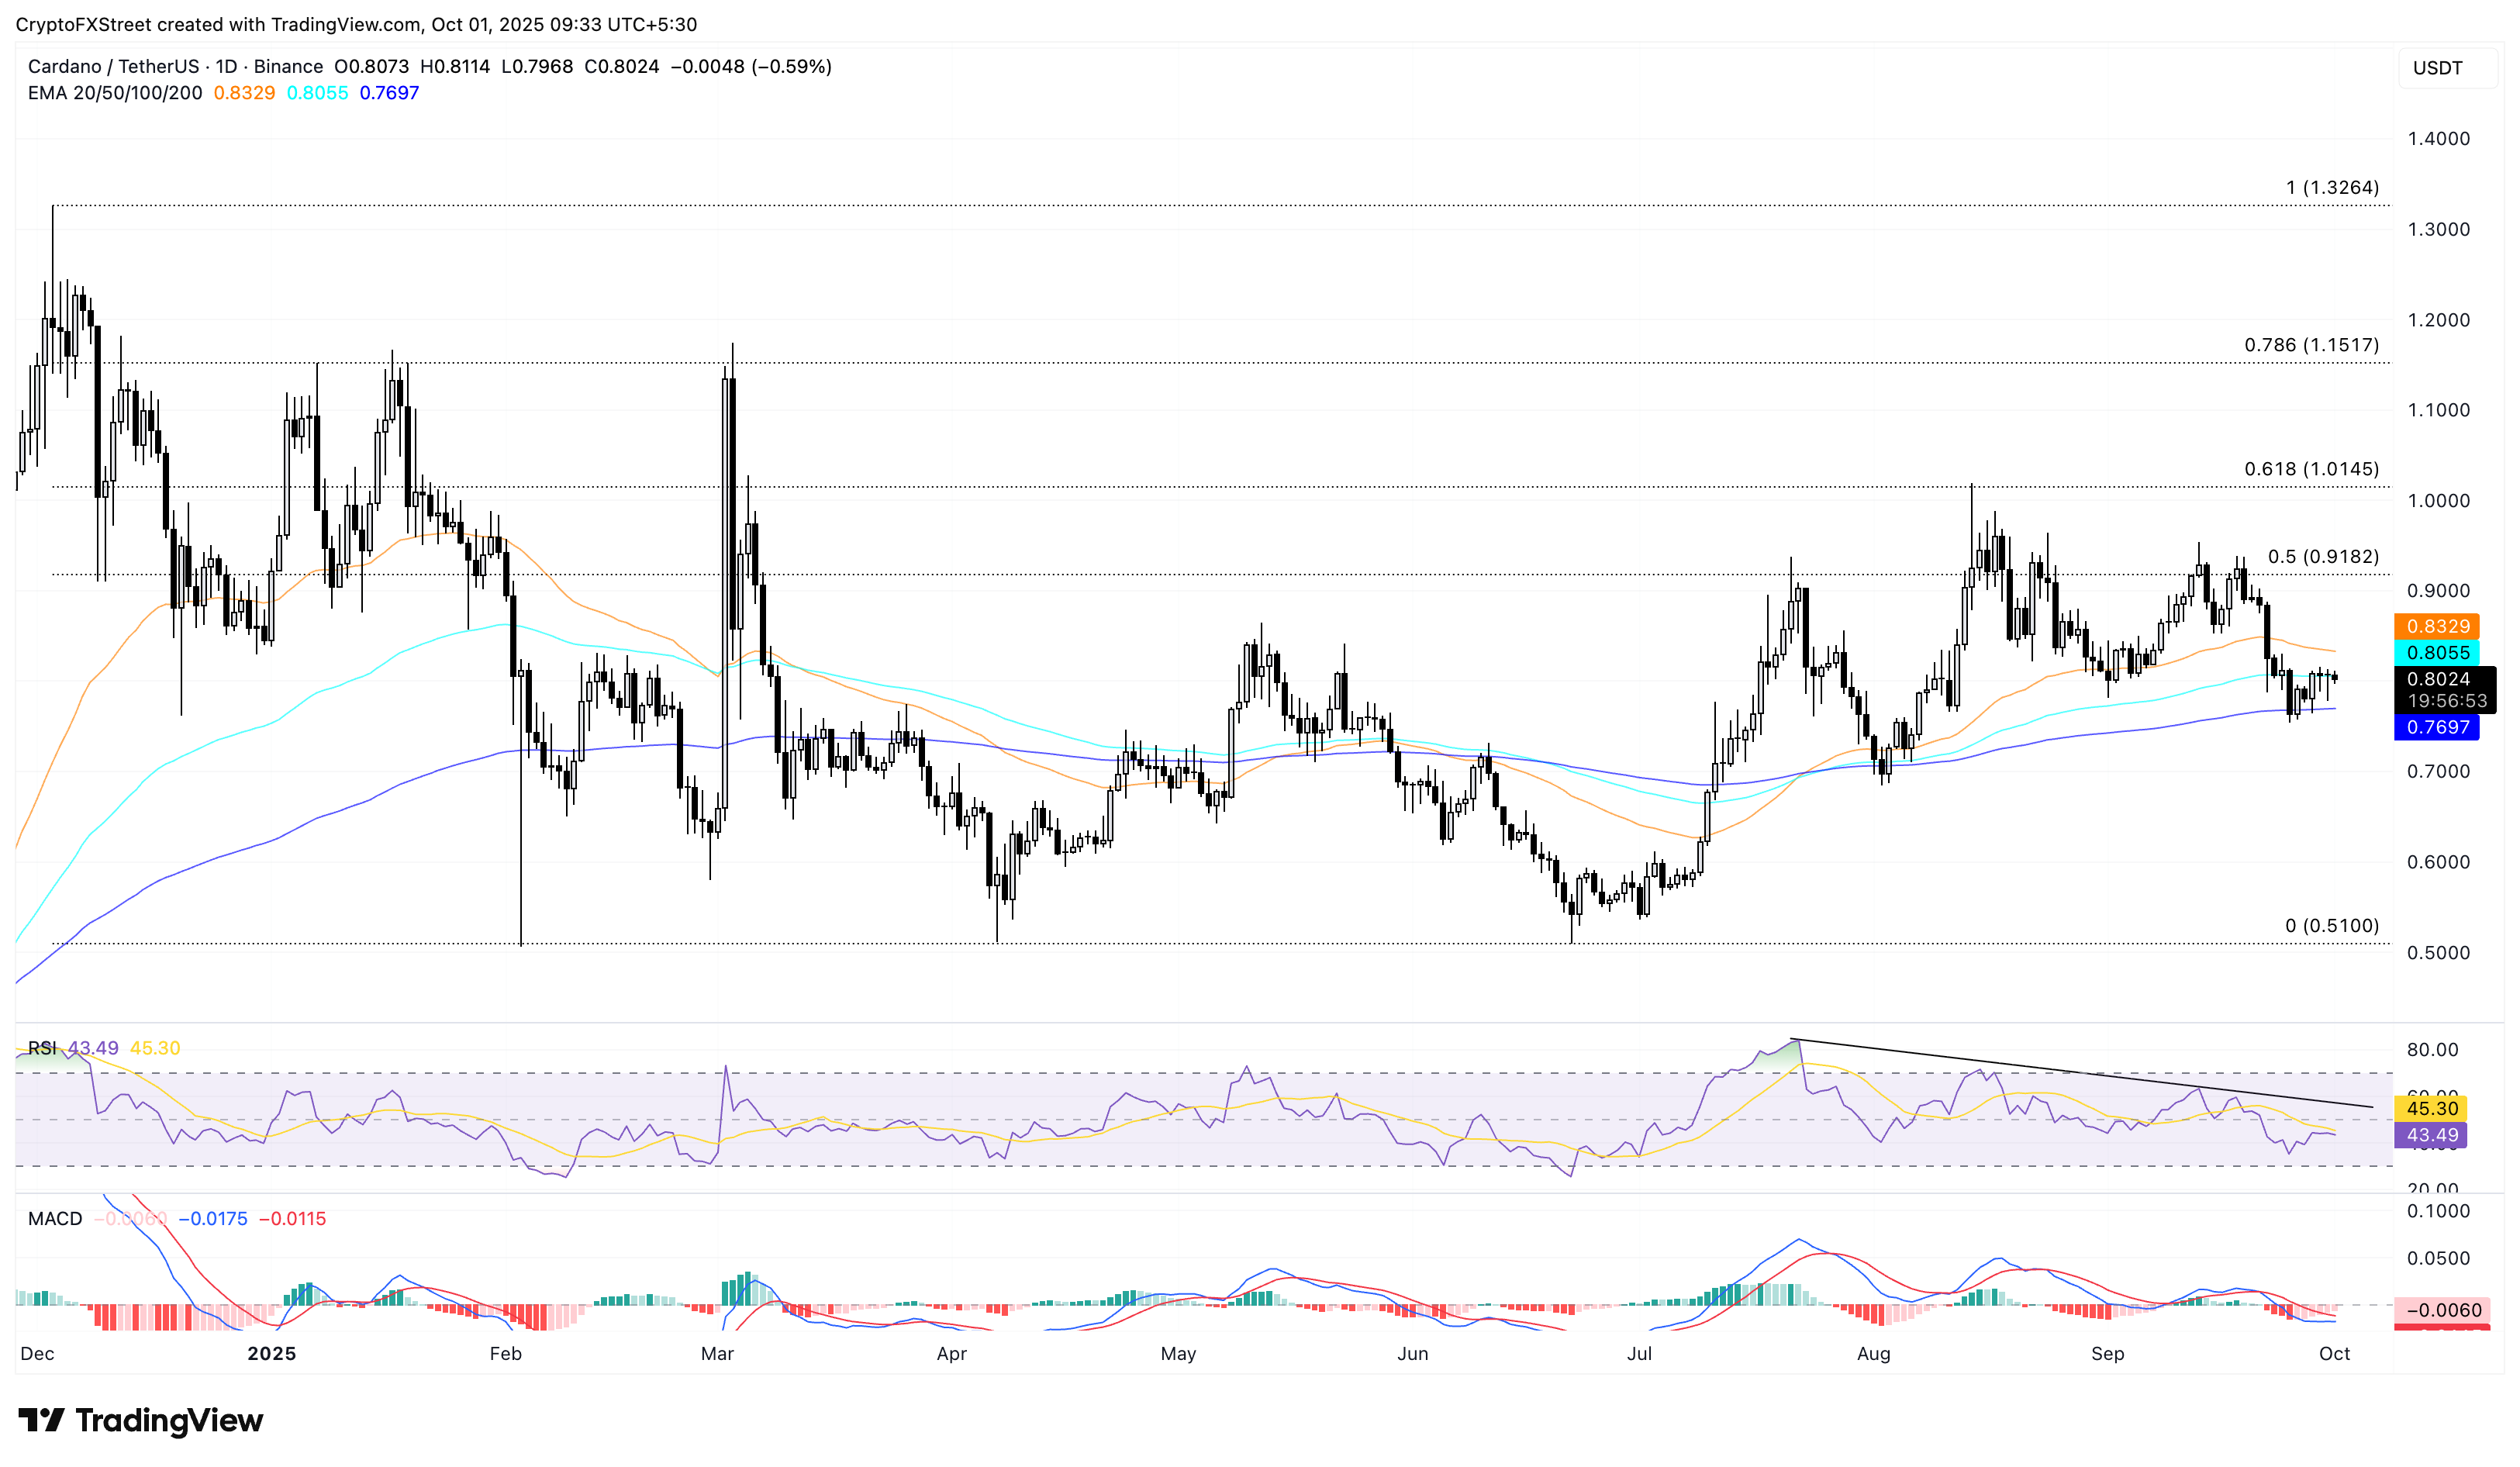
ADA/USDT daily price chart.
However, a potential flip from the 100-day EMA at $0.8055 could extend the decline to the 200-day EMA at $0.7697.
Recommended Articles


