
Ethereum Price Forecast: ETH faces rejection near key resistance despite $547 million ETF inflows
Ethereum price today: $4,120
- Ethereum ETFs saw $547 million in net inflows on Monday, halting a five-day outflow streak.
- Ethereum exchange withdrawals dominate deposits by over 117,900 ETH, a contrast to cautious signs in the futures market.
- ETH saw a rejection at a key descending trendline resistance and is testing the $4,100 key level.
Ethereum (ETH) is down 1% on Tuesday after bowing before the resistance of a descending trendline. The decline comes amid inflows of $547 million into US spot ETH exchange-traded funds (ETFs) on Monday, marking the end of a five-day outflow streak.
Ethereum ETFs return to inflows, but cautious signs remain in ETH futures
US spot Ethereum ETFs recorded net inflows of $546.96 million on Monday, their largest single-day inflow since August 14, per SoSoValue data.
Notably, the nine products saw inflows simultaneously for the first time since their launch in July 2024, with Fidelity's Ethereum Fund (FETH) and BlackRock's iShares Ethereum Trust (ETHA) leading with $202.18 million and $154.20 million, respectively.
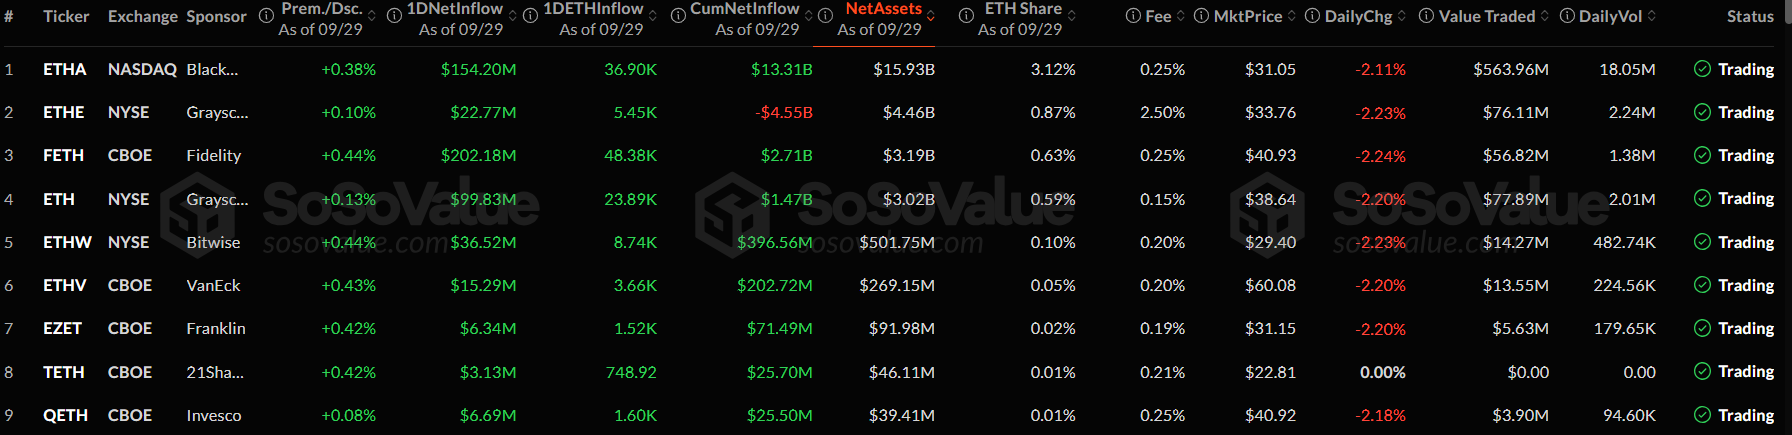
ETH ETF Flows. Source: SoSoValue
The positive move follows a brief recovery in ETH over the past few days as it looks to offset losses from its plunge below $4,000 last week, which sparked five consecutive days of net outflows, totaling $795.56 million, in ETH ETFs.
The recovery in institutional interest is accompanied by rising ETH exchange net outflows. Withdrawals from exchanges have outpaced inflows by 117,900 ETH on Tuesday, indicating a dominant bullish sentiment across the spot market, according to data from CryptoQuant. Unlike in ETFs, exchange net outflows indicate that buying pressure is higher than selling pressure.
However, signs of caution are evident in the futures market, where Ethereum's open interest has remained subdued since September 26, per Coinglass data. The lack of recovery in Ethereum's open interest — the total amount of active or unsettled contracts in its futures market — indicates a reluctance from traders to take on leverage, especially after the heavy liquidations from last week's decline.
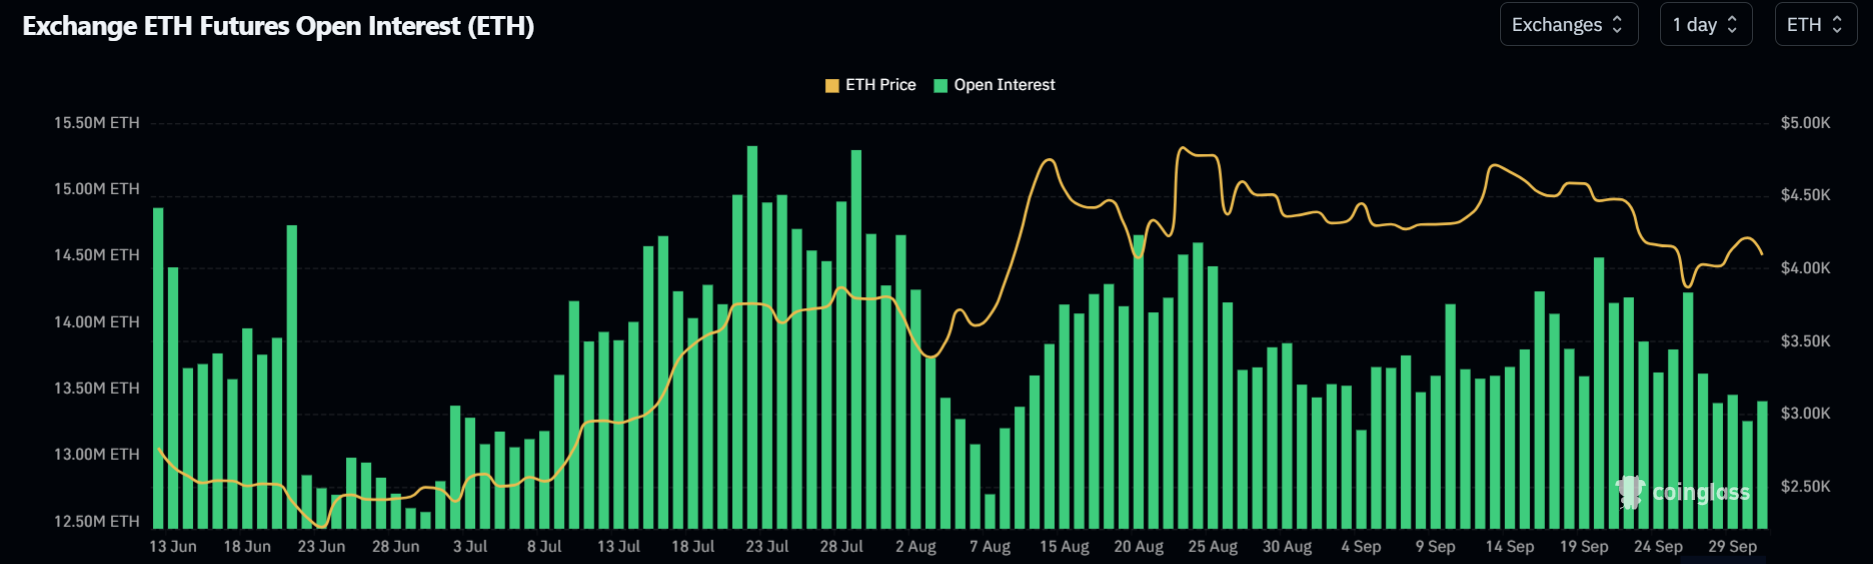
ETH Open interest. Source: Coinglass
The caution observed in the futures market comes amid growing fears of a potential US government shutdown among market participants.
Ethereum Price Prediction: ETH sees rejection at descending trendline resistance
Ethereum has seen $80.3 million in long liquidations over the past 24 hours, with $40.7 million attributed to liquidated long positions.
ETH saw a rejection at the descending trendline resistance, extending from September 13, after a weekend recovery. Following the rejection, the top altcoin is testing $4,100, a level where bears initiated selling pressure on several occasions in 2024.
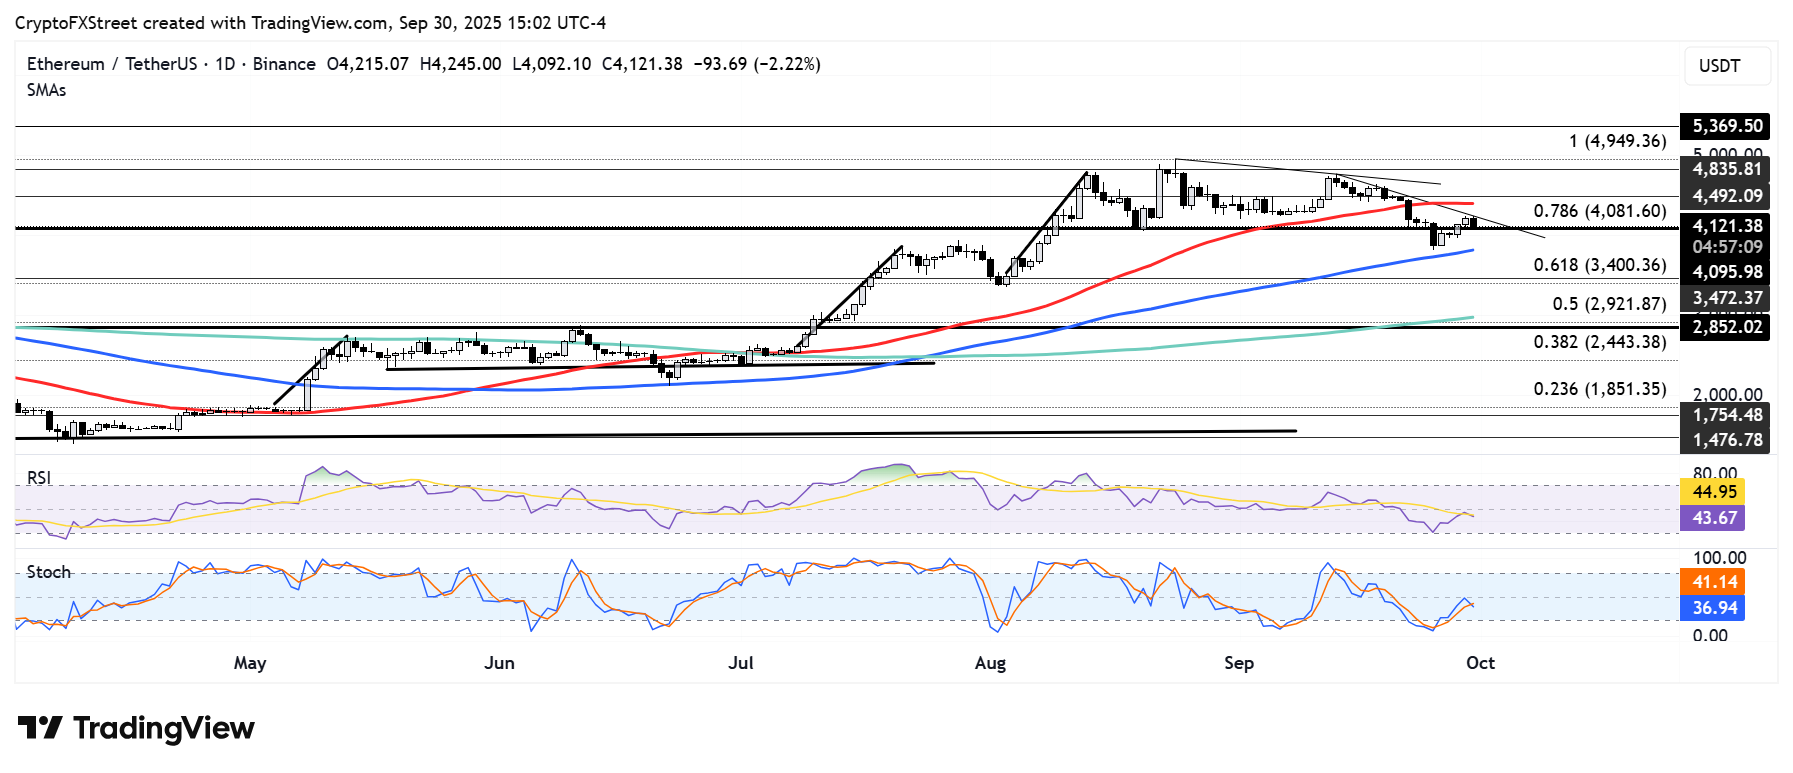
ETH/USDT daily chart
On the downside, ETH could bounce near the 100-day Simple Moving Average (SMA) if it sustains a firm decline below $4,100. Failure to hold the 100-day SMA puts a potential move toward $3,470 in focus.
On the upside, ETH has to overcome the descending trendline resistance to initiate a potential move toward $4,500.
The Relative Strength Index (RSI) and Stochastic Oscillator (Stoch) have seen a rejection near their neutral level lines and are trending downward, indicating a resumption of bearish dominance.
Recommended Articles


