

Aethir Price Forecast: ATH surges as compute hours hit 340 million in Q3
- Aethir price extends gains on Friday after soaring more than 90% this week.
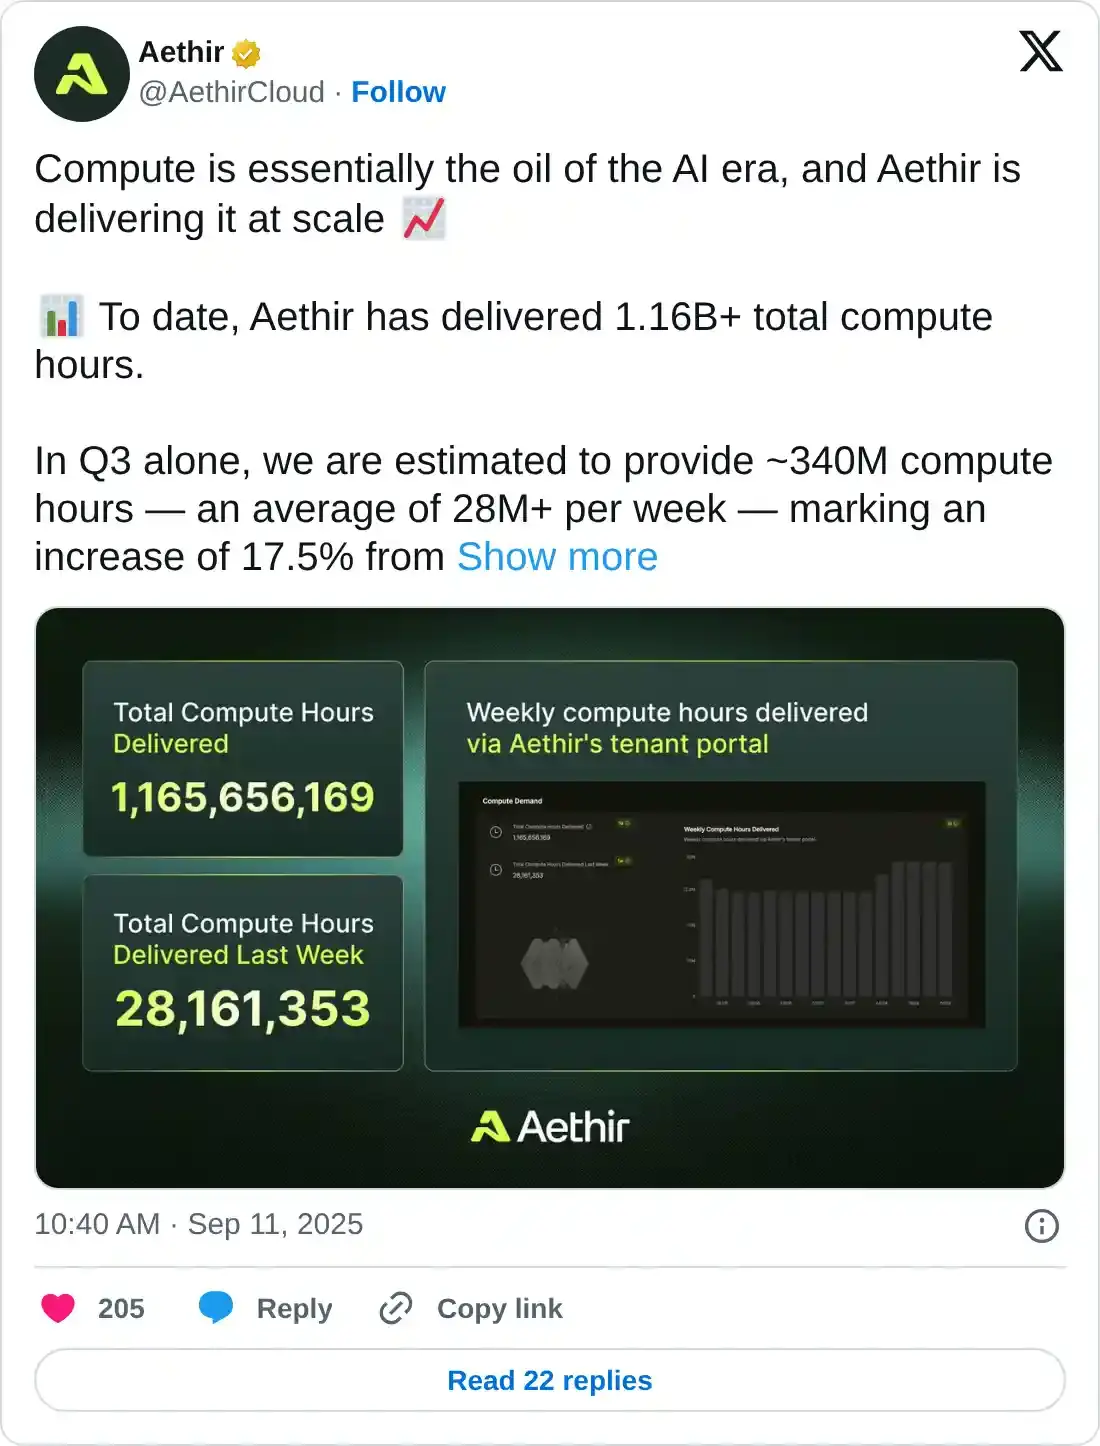
- The protocol delivered over 340 million compute hours in Q3, up 17.5% from Q2.
- The technical outlook suggests further upside, with a potential rally toward $0.065.
Aethir (ATH) price extends its gains by 14% trading above $0.056 at the time of writing on Friday, after soaring more than 90% this week. The rally comes as the protocol delivered over 340 million compute hours in Q3, up 17.5% from Q2. Technical analysis suggests a further rally, with bulls targeting the $0.065 mark.
Aethir surges as “oil of the AI era,” compute demand fuels growth
Aethir price has surged more than 90% so far this week, reaching a four-month high, with its market capitalization climbing past $683.92 million on Friday, according to CoinGecko data, shown below.
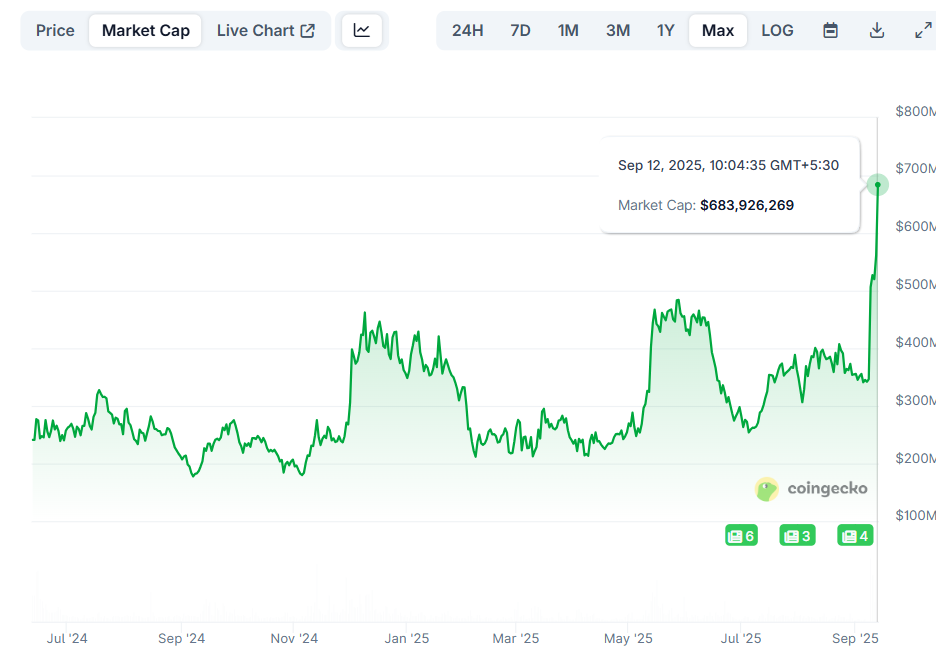
This rally comes as demand for compute—often described as the oil of the AI era—continues to grow, with Aethir delivering it at scale. In Q3, ATH provided 340 million compute hours, with an average of over 28 million per week, representing a 17.5% increase from the previous quarter. Moreover, since its launch, Aethir’s Decentralized Physical Infrastructure Network (DePIN) has delivered more than 1.16 billion total compute hours.
In addition to rising compute demand, Aethir generated an average of $13 million in monthly revenue during July and August, highlighting the protocol’s growing financial momentum.

Moreover, earlier this month, Aethir broadened its ecosystem with key partnerships. Teaming up with AR.IO to join the AI Unbundled Alliance, supporting Everlyn’s video AI model, and enabling Clore.ai to deliver global, scalable, and affordable access to enterprise-grade GPUs through its infrastructure.
Aethir Price Forecast: ATH bulls aiming for $0.065 mark
Aethir price broke above the descending trendline (drawn by joining multiple highs with a trendline since December) and its consolidating range between $0.028 and $0.037 on Monday, rallying nearly 50% that day. ATH continued its gains for the next three days, soaring over 8%. At the time of writing on Friday, it continues to trade higher by 14% reaching a four-month high at $0.056.
If ATH continues its upward momentum, it could extend its gains toward its weekly resistance at $0.065.
The Relative Strength Index (RSI) on the daily chart read 82, above its overbought conditions, indicating strong bullish momentum. The Moving Average Convergence Divergence (MACD) also showed a bullish crossover on Monday, giving buy signals. Moreover, the rising green histogram bars above the neutral value further support the bullish thesis.
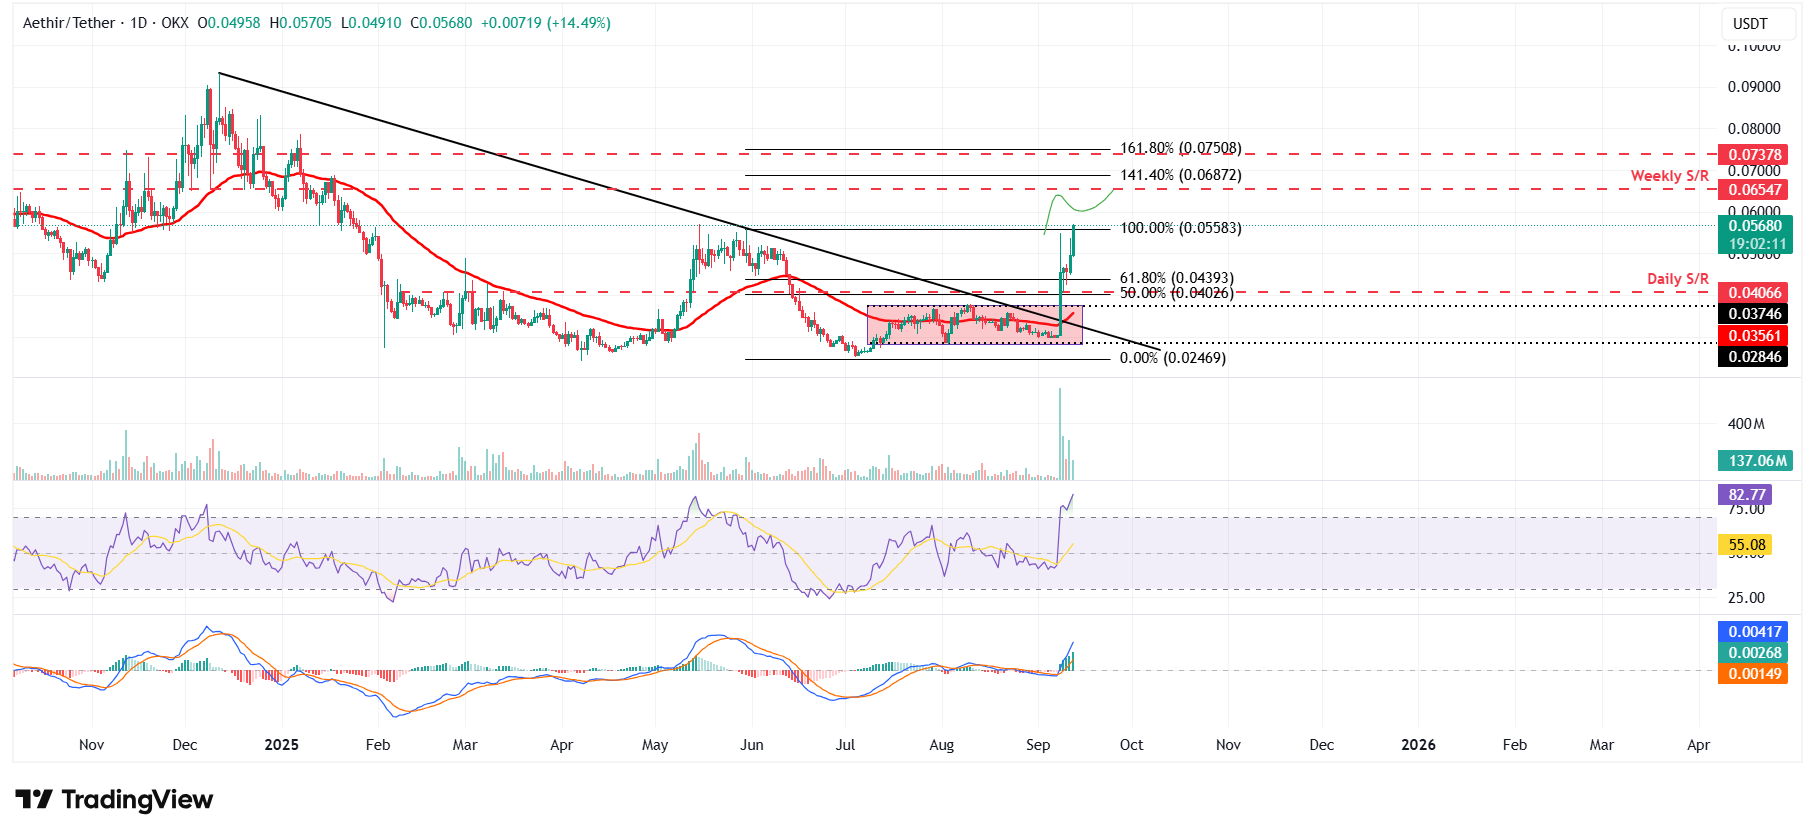
ATH/USDT daily chart
However, if ATH faces a correction, it could extend the decline toward its daily support at $0.040.
Recommended Articles


