
Hedera Price Forecast: HBAR price surges as Archax launches Pool Token functionality on its network
- Hedera price breaks above falling wedge pattern, signaling a bullish move ahead.
- Archax, a UK-regulated digital asset exchange, has announced the launch of its Pool Token functionality on the Hedera Network.
- The technical outlook suggests a rally, with bulls targeting the $0.305 mark.
Hedera (HBAR) price hovers around $0.234 at the time of writing on Thursday after breaking above the falling wedge pattern the previous day. This breakout favors the bulls and follows Archax’s partnership with HBAR on Wednesday to launch its Pool Token functionality, bringing multi-asset portfolios to the Hedera network. Meanwhile, technical analysis suggests a rally in the upcoming days, with bulls targeting the $0.305 mark.
Hedera powers Archax's Pool Token launch, blending top money market funds
Archax, a UK-regulated digital asset exchange, custodian, and brokerage that also holds exchange permissions in Europe, announced on Wednesday the launch of its Pool Token functionality on the Hedera Network. This enables a new on-chain functionality that allows portfolios, baskets, or funds to be created as a single, transferable token.
The range of underlying asset types is highly diverse, encompassing equity, debt, funds, and cryptocurrencies in this Pool Token, which allows diverse investment strategies in a single transferable token.
“The first Pool Token being minted on Hedera will hold equal parts of money market funds from four leading asset managers: Aberdeen, BlackRock, State Street, and Legal & General – effectively creating a natively digital ‘fund of money market funds’,” said Archax in a press release.
This announcement triggered a 2.69% surge in the HBAR token price on Wednesday. However, this development is bullish in the long term as it strengthens Hedera’s institutional credibility, positioning it as a serious Real World Asset (RWA) player and the first market mover for a low-cost, high-throughput model suited for institutional-grade tokenisation.
Hedera Price Forecast: HBAR breaks above falling wedge pattern
Hedera price broke above the falling wedge pattern (drawn by connecting multiple highs and lows with two trendlines since the end of July) on Wednesday. A breakout of this pattern favors the bulls, and at the time of writing on Thursday, it hovers at around $0.234.
If HBAR continues its upward momentum, it could extend the rally toward its July 27 high at $0.305.
The Relative Strength Index (RSI) on the daily chart has moved above its neutral level of 50, indicating early signs of bullish momentum. Moreover, the Moving Average Convergence Divergence (MACD) also showed a bullish crossover on Tuesday, giving buy signals and further supporting the bullish outlook.
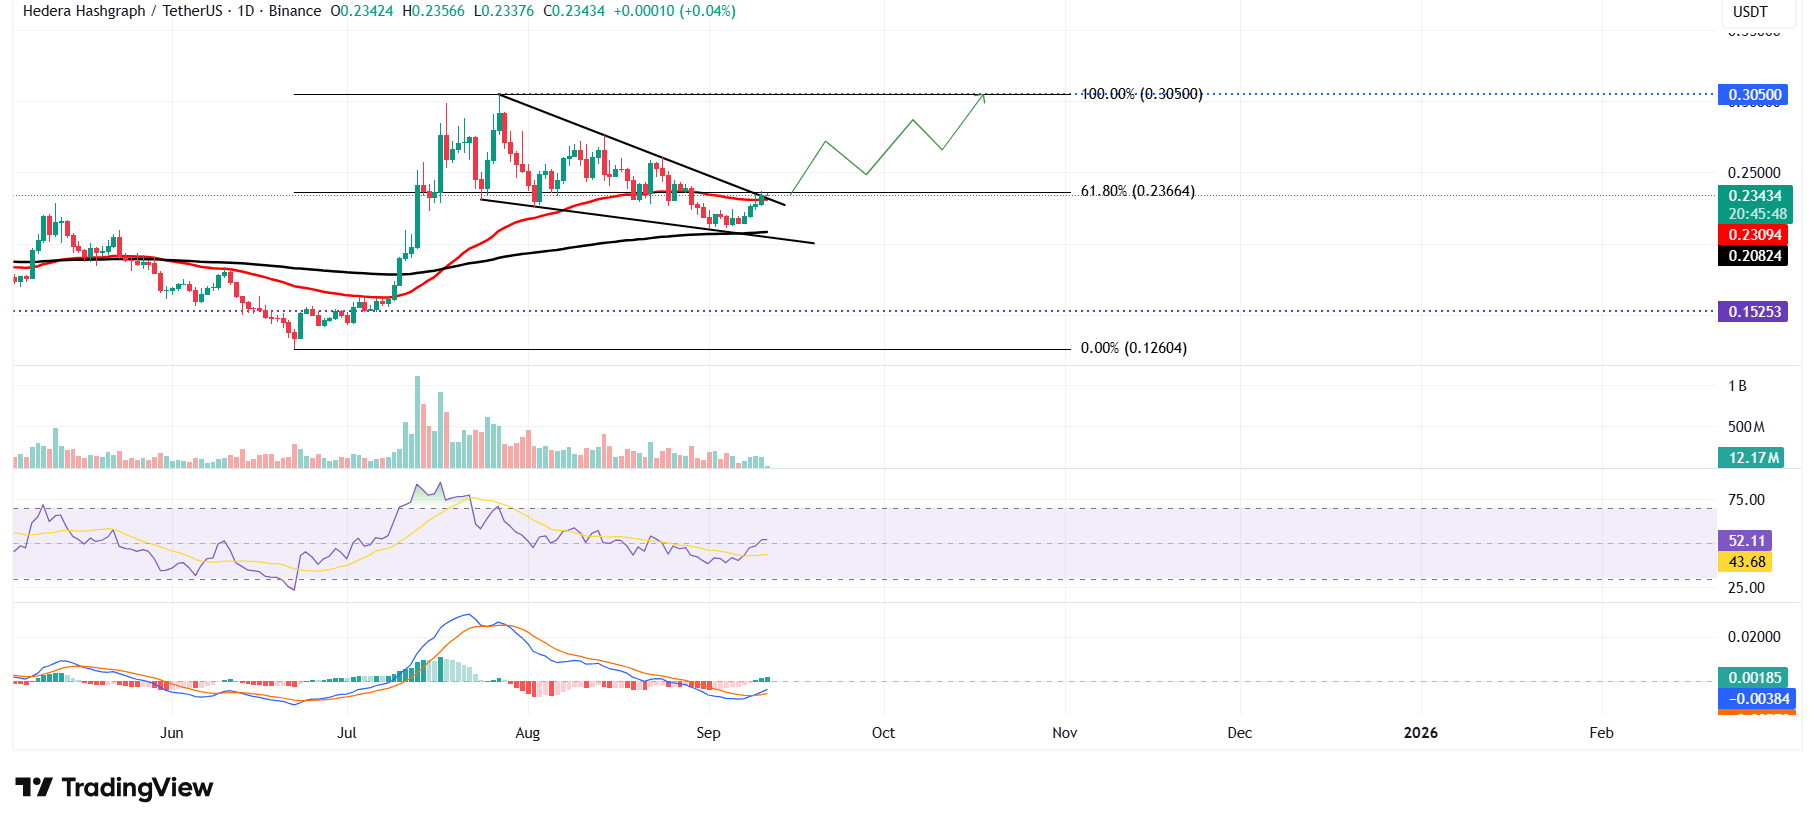
HBAR/USDT daily chart
However, if HBAR faces a correction, it could extend the decline toward its 200-day Exponential Moving Average (EMA) at $0.208, which roughly coincides with the lower trendline of the falling wedge pattern.
Recommended Articles


