
Top 3 Price Prediction: BTC finds footing, ETH pauses, while XRP signals bullishness

- Gold tumbles as traders book profits ahead of key US inflation data
- Australian Dollar remains stronger following PBoC interest rate decision
- Gold tumbles as traders book profits ahead of key US inflation data
- Forex Today: US Dollar extends slide, Gold surges past $4,300
- Meme Coins Price Prediction: Dogecoin, Shiba Inu, Pepe flash bearish potential
- Japanese Yen strengthens on safe-haven flows, USD/JPY tests 150.00 amid weaker USD

Bitcoin price hovers around $111,000 on Wednesday after facing rejection from its 50-day EMA at $112,800.
Ethereum consolidated between $4,232 and $4,488 for the last 12 days, signaling indecisiveness among traders.
Ripple price trades within a falling wedge, a breakout signals a potential bullish move ahead.
Bitcoin (BTC) price holds steady around $111,000 at the time of writing on Wednesday after facing a mild rejection the previous day. Ethereum (ETH) price has been trading sideways for over a week, indicating indecisiveness among traders. Meanwhile, Ripple (XRP) shows a bullish setup; a breakout could trigger a rally ahead.
Bitcoin could rally if it closes above the 50-day EMA
Bitcoin price extended its recovery on Monday, reaching its 50-day Exponential Moving Average (EMA) at $112,830 the following day, but faced rejection around that level. At the time of writing on Wednesday, it holds steady at around $111,000.
If BTC closes above the 50-day EMA at $112,830 on a daily basis, it could extend the rally toward its next daily resistance at $116,000.
The Relative Strength Index (RSI) reads 43 after facing rejection from its neutral level of 50 on Tuesday, indicating signs of bearish momentum. However, the Moving Average Convergence Divergence (MACD) indicator showed a bullish crossover on Saturday, providing a buy signal. Moreover, it also shows rising green histogram bars above its neutral level, indicating bullish momentum and an upward trend ahead.
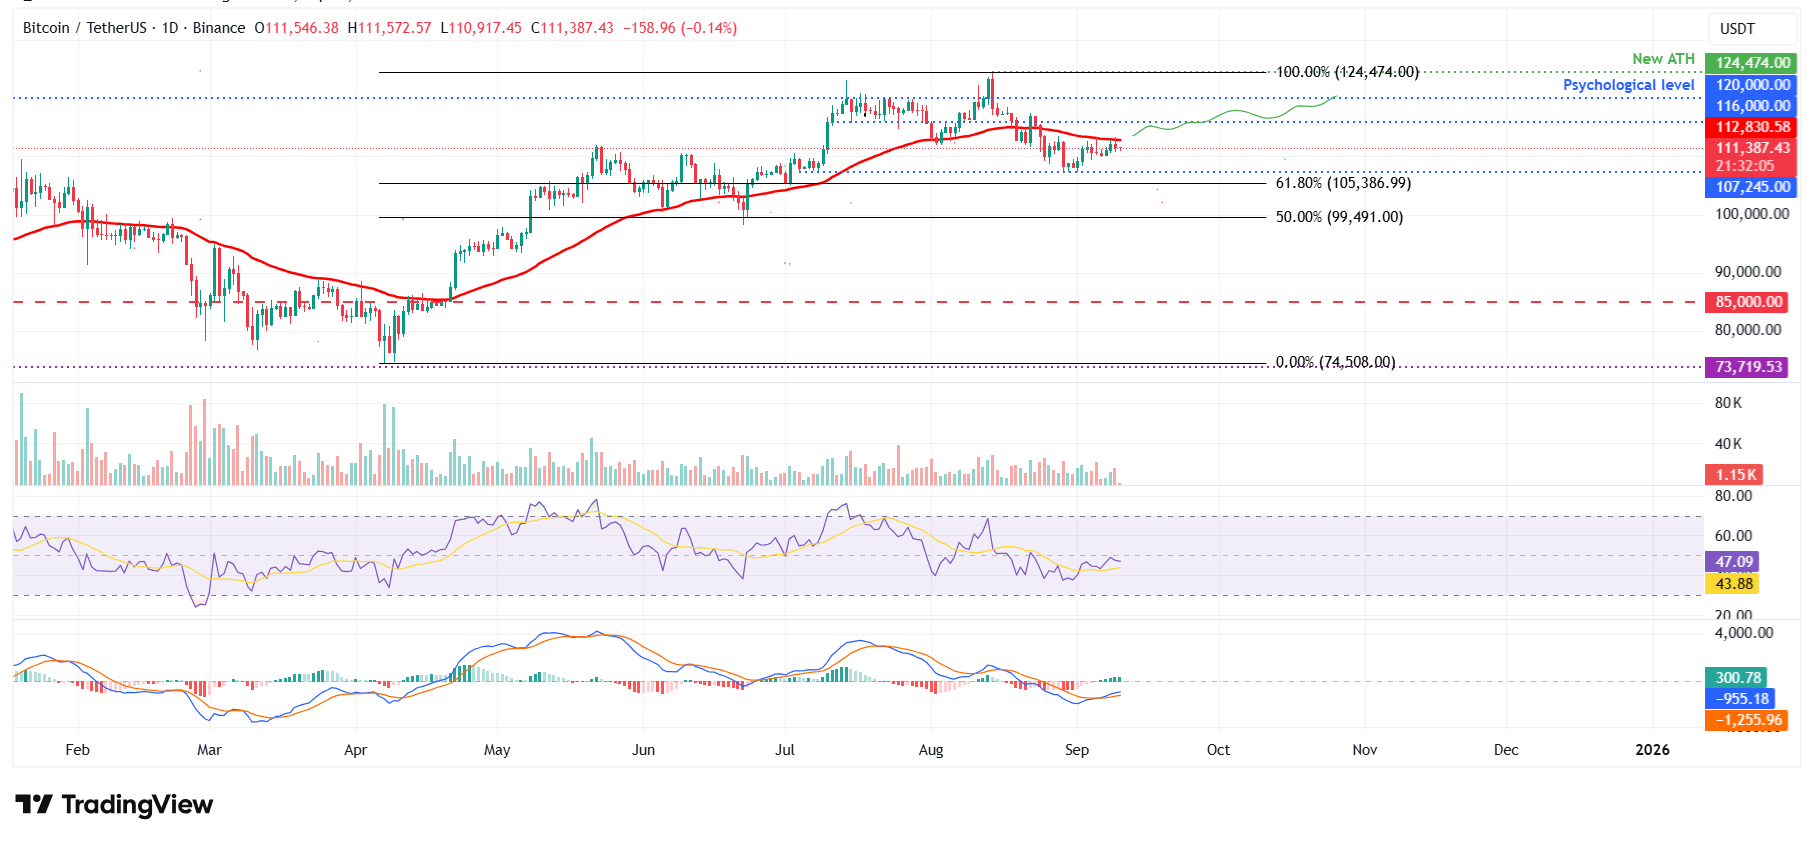
BTC/USDT daily chart
However, if BTC fails to close above its 50-day EMA at $112,830 and corrects, it could extend the decline toward its daily support at $107,245.
Ethereum trades sideways, hinting at indecision among traders
Ethereum price has been trading sideways between $4,232 and $4,488 for the last 12 days, since August 29. At the time of writing on Wednesday, it hovers at around $4,319.
Assuming that ETH breaks above the upper boundary at $4,488, it could extend the rally towards its record high at $4,956.
The RSI on the daily chart has been hovering around its neutral level of 50 since September 4, indicating indecisiveness among traders.
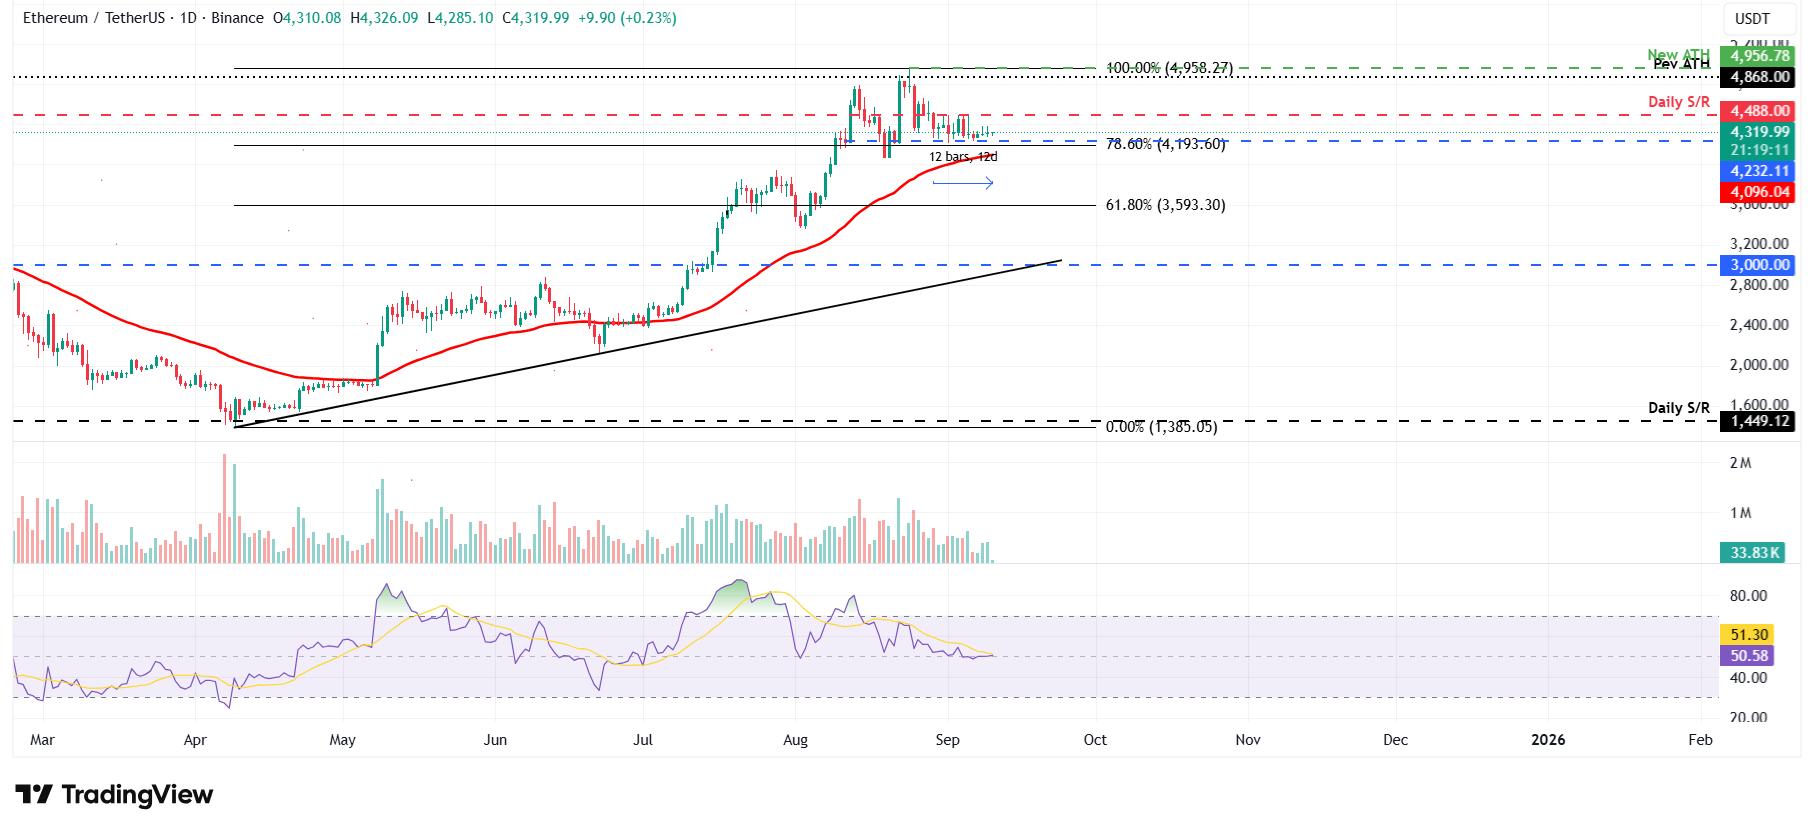
ETH/USDT daily chart
If ETH closes below the lower boundary at $4,232, it could extend the decline toward its 50-day EMA at $4,096
Ripple shows a bullish setup
Ripple price trades within a falling wedge pattern (drawn by connecting multiple highs and lows with two trendlines since mid-July). At the time of writing on Wednesday, it is nearing its upper trendline boundary, and a breakout favors the bulls.
If XRP closes above the upper trendline boundary around $2.99 on a daily basis, it could extend the rally toward its daily resistance at $3.40.
The RSI on the daily chart stands at 52, having moved above its neutral level of 50, indicating early signs of bullish momentum. Additionally, the MACD showed a bullish crossover on Monday, giving buy signals and indicating improving momentum, which supports the bullish view.
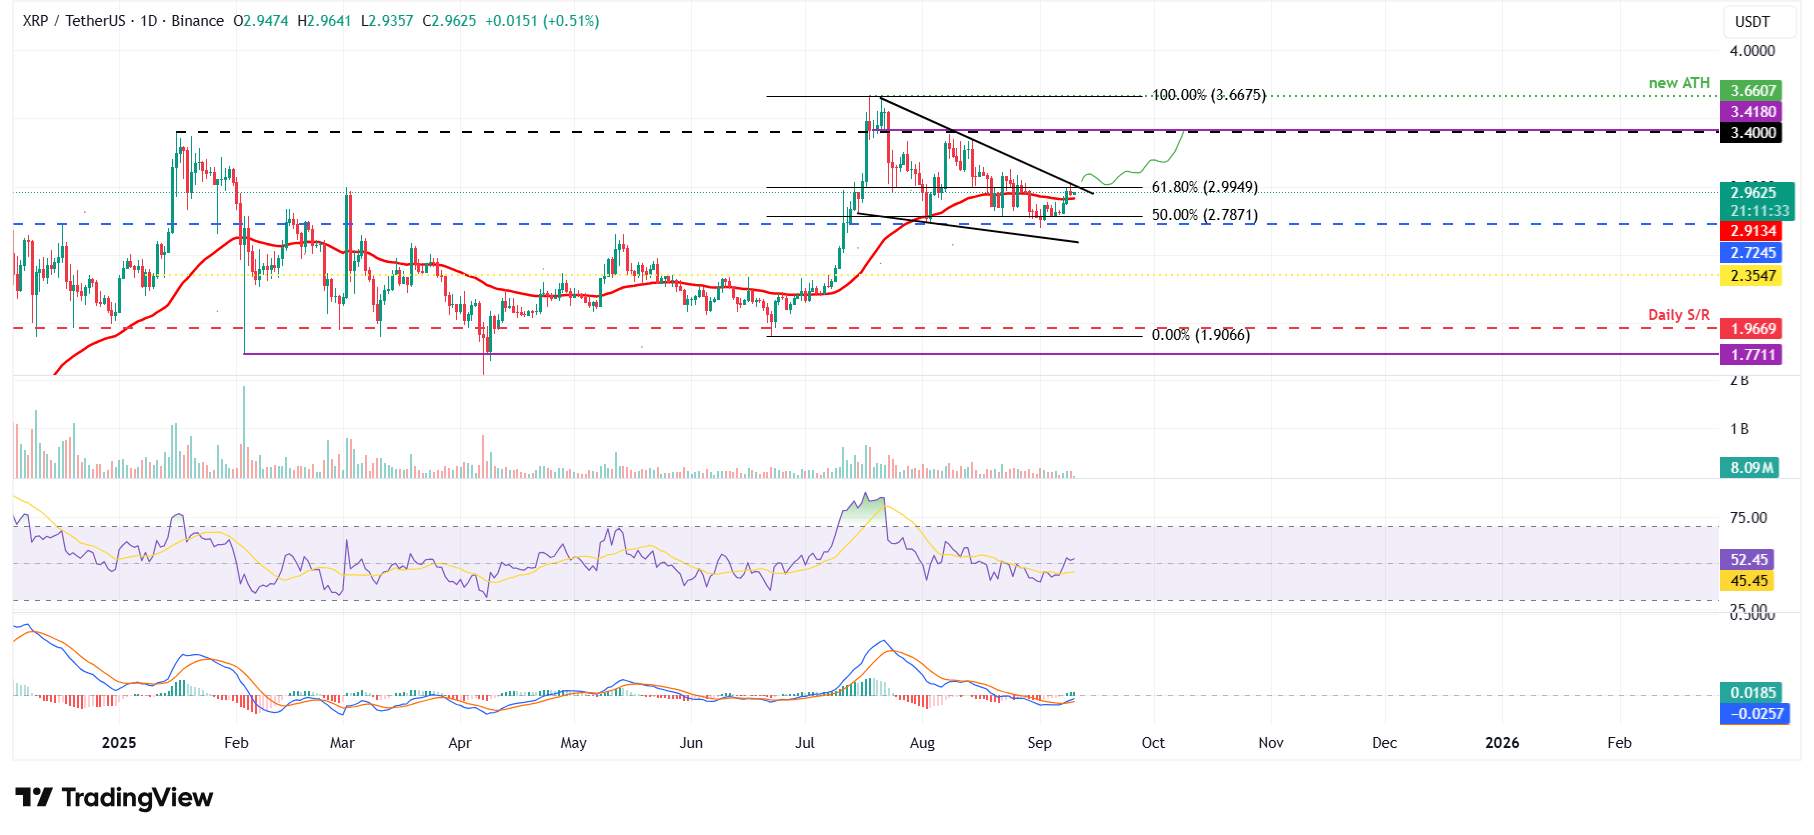
XRP/USDT daily chart
However, if XRP faces rejection from the upper trendline of the pattern, it could extend the decline toward its daily support at $2.72.
Read more
* The content presented above, whether from a third party or not, is considered as general advice only. This article should not be construed as containing investment advice, investment recommendations, an offer of or solicitation for any transactions in financial instruments.


