

SUI TVL reaches all-time high above $720 million as markets anticipate Sui Basecamp

Source Fxstreet
  • Sui price is up 30% this week with most gains registered on Wednesday with TVL going past $720 million.
  • SUI could extend higher amid anticipation for the Sui Basecamp from April 10-11 in Paris, France.
  • A break and close below $1.2806 support would invalidate the bullish thesis.  

Looking at tokens built using the Move programming language, Sui (SUI) is an outlier, outperforming its peer Aptos (APT). While Sui price is up almost 20% in the past 24 hours, its counterpart on the Move code, Aptos, has dropped nearly 10%. Alongside the surge in price for SUI, the Layer 1 (L1) token’s total value locked (TVL) has also recorded a new all-time high (ATH).

Also Read: SUI bridged nearly $310 million in assets from Ethereum, exceeding all other blockchains combined

SUI TVL explodes past $720 million

Sui price has exploded, and with it, the TVL. Sui’s TVL recorded a new all-time high at $726 million. Notably, this momentous milestone has been achieved in a record less than a year since Mainnet launch.
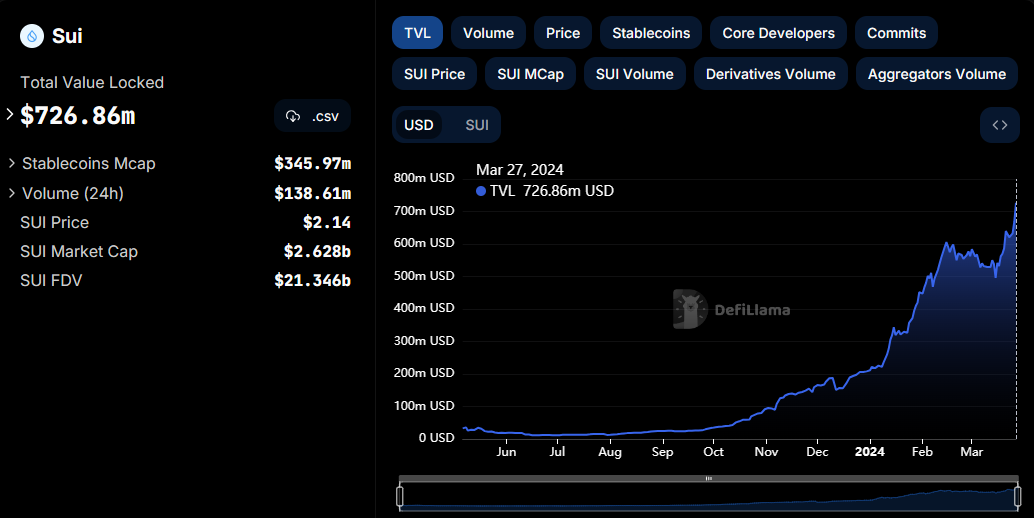
SUI TVL

A rise in TVL, effectively representing a rise in capital locked into a protocol, shows a growing user base and increased capital inflows. It also points to greater trust and confidence in the concerned protocol as users find value in the protocol and are open to locking their assets with that protocol.

Meanwhile, the network is about two weeks from the Sui Basecamp, scheduled for April 10-11, 2024. Marking the inaugural global event for Web3 pioneers, the Sui Basecamp will bring together builders, developers, thought-leaders, and enterprises.

With the theme to inspire the future of Web3, the Sui Basecamp will see industry luminaries share insights on emerging technologies, key trends and the rise of Web3, with participants getting an opportunity to connect and participate in discussions.

SUI price could rally 50% ahead of Sui Basecamp

As long as the broader market continues to run, Sui price could continue with the gains until at least April 10, in line with the “buy-the-rumor, sell-the-news” situation. Based on the Fibonacci retracement indicator, enhanced gains could see the SUI price rise about 50% to $3.3140 level.

A candlestick close above $2.1900 on the three-day time frame would attract more buyers. Multiple technical indicators lean in favor of the upside, starting with the Relative Strength Index (RSI) climbing to signify rising momentum.

The Awesome Oscillator (AO) histograms have also sustained a series of green bars, indicating growing bullish sentiment. The Moving Average Convergence Divergence (MACD) indicator accentuates this, as it is about to record a bullish crossover above the signal line (orange band). The move would signal the beginning of yet another bullish cycle.
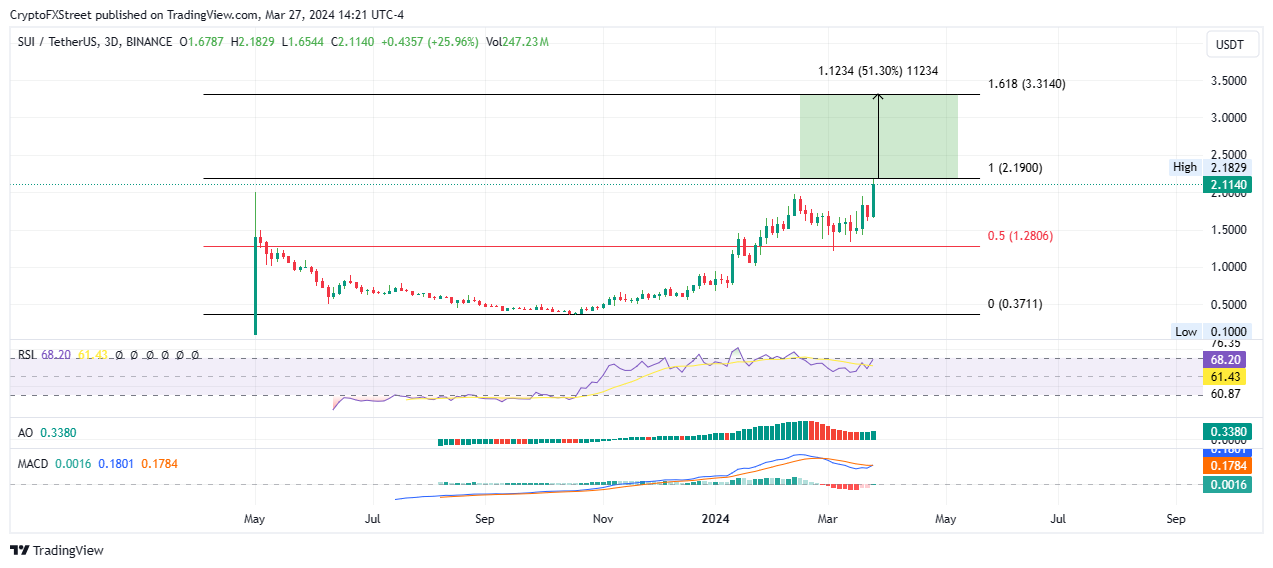
SUI/USDT 3-day chart

On the other hand, if traders cash in on the gains made so far, the Sui price could retract, potentially revisiting the 50% Fibonacci placeholder at $1.2806. A three-day candlestick close below this level would invalidate the bullish thesis, with the fall likely to extend to the $1.0000 psychological level. 

Also Read: Altcoins that show strength during Bitcoin price decline: JUP, SEI, AVAX, GALA and Sui

Disclaimer: For information purposes only. Past performance is not indicative of future results.
placeholder
Gold Price Analysis Today | Forex Gold Analysis | XAU/USD Analysis - November 11, 2026Get the latest gold price analysis, forex gold insights, and XAU/USD analysis for November 11, 2026. Read on for the details.
Author  Mitrade
Nov 11, Wed
Get the latest gold price analysis, forex gold insights, and XAU/USD analysis for November 11, 2026. Read on for the details.
placeholder
Bitcoin lost its 200-day average — but the exit started three sessions before the CPIBitcoin fell 2.5% to about $73,400 on 11 November, an 11-week low, breaking its 200-day moving average near $73,100. The 24-hour liquidation tally reached $632 to $705 million, roughly 82% of it longs. But spot ETF outflows began three sessions earlier and USDT's market cap has shrunk $6.6 billion in 60 days — the leveraged length left before the inflation print did. A double top at 81,890 and 81,080 leaves a measured target of 69,366.
Author  Suzie
Nov 11, Wed
Bitcoin fell 2.5% to about $73,400 on 11 November, an 11-week low, breaking its 200-day moving average near $73,100. The 24-hour liquidation tally reached $632 to $705 million, roughly 82% of it longs. But spot ETF outflows began three sessions earlier and USDT's market cap has shrunk $6.6 billion in 60 days — the leveraged length left before the inflation print did. A double top at 81,890 and 81,080 leaves a measured target of 69,366.
placeholder
Nvidia slid 7.7% after hours while AMD and Broadcom rose — the AI trade changed hands, it didn't breakNvidia closed Wednesday at 173.73, up 2.87%, then fell as much as 8.1% to 159.44 after reports that its board was preparing for a possible leadership change. The same session, the Philadelphia Semiconductor Index rose 5.7% with all 30 components higher, CoreWeave jumped 24.7% on 168% revenue growth, and Micron added 11.9%. If AI demand were being repriced, AMD and Broadcom would not be bid. This is a governance discount on one name, and 204.54 — the 200-day average — is the level that settles it.
Author  Irene Q.
Nov 12, Thu
Nvidia closed Wednesday at 173.73, up 2.87%, then fell as much as 8.1% to 159.44 after reports that its board was preparing for a possible leadership change. The same session, the Philadelphia Semiconductor Index rose 5.7% with all 30 components higher, CoreWeave jumped 24.7% on 168% revenue growth, and Micron added 11.9%. If AI demand were being repriced, AMD and Broadcom would not be bid. This is a governance discount on one name, and 204.54 — the 200-day average — is the level that settles it.
placeholder
Gold hit a one-year low while central banks bought 321 tonnes — the sellers were never the ones you thinkSpot gold closed at 3,876 on Thursday, down 2.8% and its lowest close in more than a year, with an intraday low near 3,852. The dollar is at a 19-month high of 103.21 and the 10-year yield is at 5.10%, so the price move is easy to explain. What is harder to explain is who sold: central banks bought 321 tonnes in Q3, the PBoC added for a 24th straight month, ETF holdings are near a record 4,256 tonnes, and roughly 95% of the futures selling came from non-reportable and sovereign-type accounts rather than hedge funds. This piece separates the two books that have to balance.
Author  Irene Q.
Yesterday 02: 40
Spot gold closed at 3,876 on Thursday, down 2.8% and its lowest close in more than a year, with an intraday low near 3,852. The dollar is at a 19-month high of 103.21 and the 10-year yield is at 5.10%, so the price move is easy to explain. What is harder to explain is who sold: central banks bought 321 tonnes in Q3, the PBoC added for a 24th straight month, ETF holdings are near a record 4,256 tonnes, and roughly 95% of the futures selling came from non-reportable and sovereign-type accounts rather than hedge funds. This piece separates the two books that have to balance.
placeholder
Brent rose 3.3% and US crude stocks built 4.66 million barrels in the same weekBrent January settled at 95.82, up 3.3%, and WTI at 88.74, up 2.55%, after the US signalled it would not pursue a deal with Iran and attacks on Gulf shipping continued. In the same week, EIA data showed US crude inventories rising 4.657 million barrels against expectations of a 1.1 million draw, with gasoline up another 1.799 million. OPEC output also rebounded 1.96 million barrels a day to 27.16 million in October, led by Saudi Arabia at 10.56 million. This piece separates the geopolitical premium from the physical balance and lays out where each side of the trade is anchored.
Author  Irene Q.
Yesterday 03: 06
Brent January settled at 95.82, up 3.3%, and WTI at 88.74, up 2.55%, after the US signalled it would not pursue a deal with Iran and attacks on Gulf shipping continued. In the same week, EIA data showed US crude inventories rising 4.657 million barrels against expectations of a 1.1 million draw, with gasoline up another 1.799 million. OPEC output also rebounded 1.96 million barrels a day to 27.16 million in October, led by Saudi Arabia at 10.56 million. This piece separates the geopolitical premium from the physical balance and lays out where each side of the trade is anchored.
goTop
quote