

Crypto Today: Bitcoin sell-off sends jitters across the market, Ethereum, XRP wobble
- Bitcoin extends decline below the 100-day EMA as bulls eye weekly support at around $108,500.
- Ethereum falls 11% from its record high, reflecting risk-off sentiment and shrinking ETF inflows.
- XRP maintains a bearish outlook as selling pressure outweighs demand below $3.00.
Cryptocurrencies remain under pressure on Friday, reflecting risk-off sentiment ahead of September. Attempts to sustain Bitcoin (BTC) price recovery have consistently failed, with Bitcoin trading below $110,000 at the time of writing.
Altcoins have not been spared, with Ethereum (ETH) leading the correction amid rampant profit-taking, following the run-up to a record high of $4,955 on Sunday. The largest smart contracts token holds above $4,300, but downside risks persist.
Data spotlight: Bitcoin ETF inflows steady
Interest in Bitcoin spot Exchange Traded Funds (ETFs) operating in the United States (US) is gaining momentum, as evidenced by the steady rise in inflows this week. According to SoSoValue data, BTC spot ETFs saw inflows of $179 million on Thursday, marking the fourth consecutive day of bullish activity. None of the 12 ETFs posted outflows, with Ark Invest’s ARKB leading with approximately $80 million in inflows.
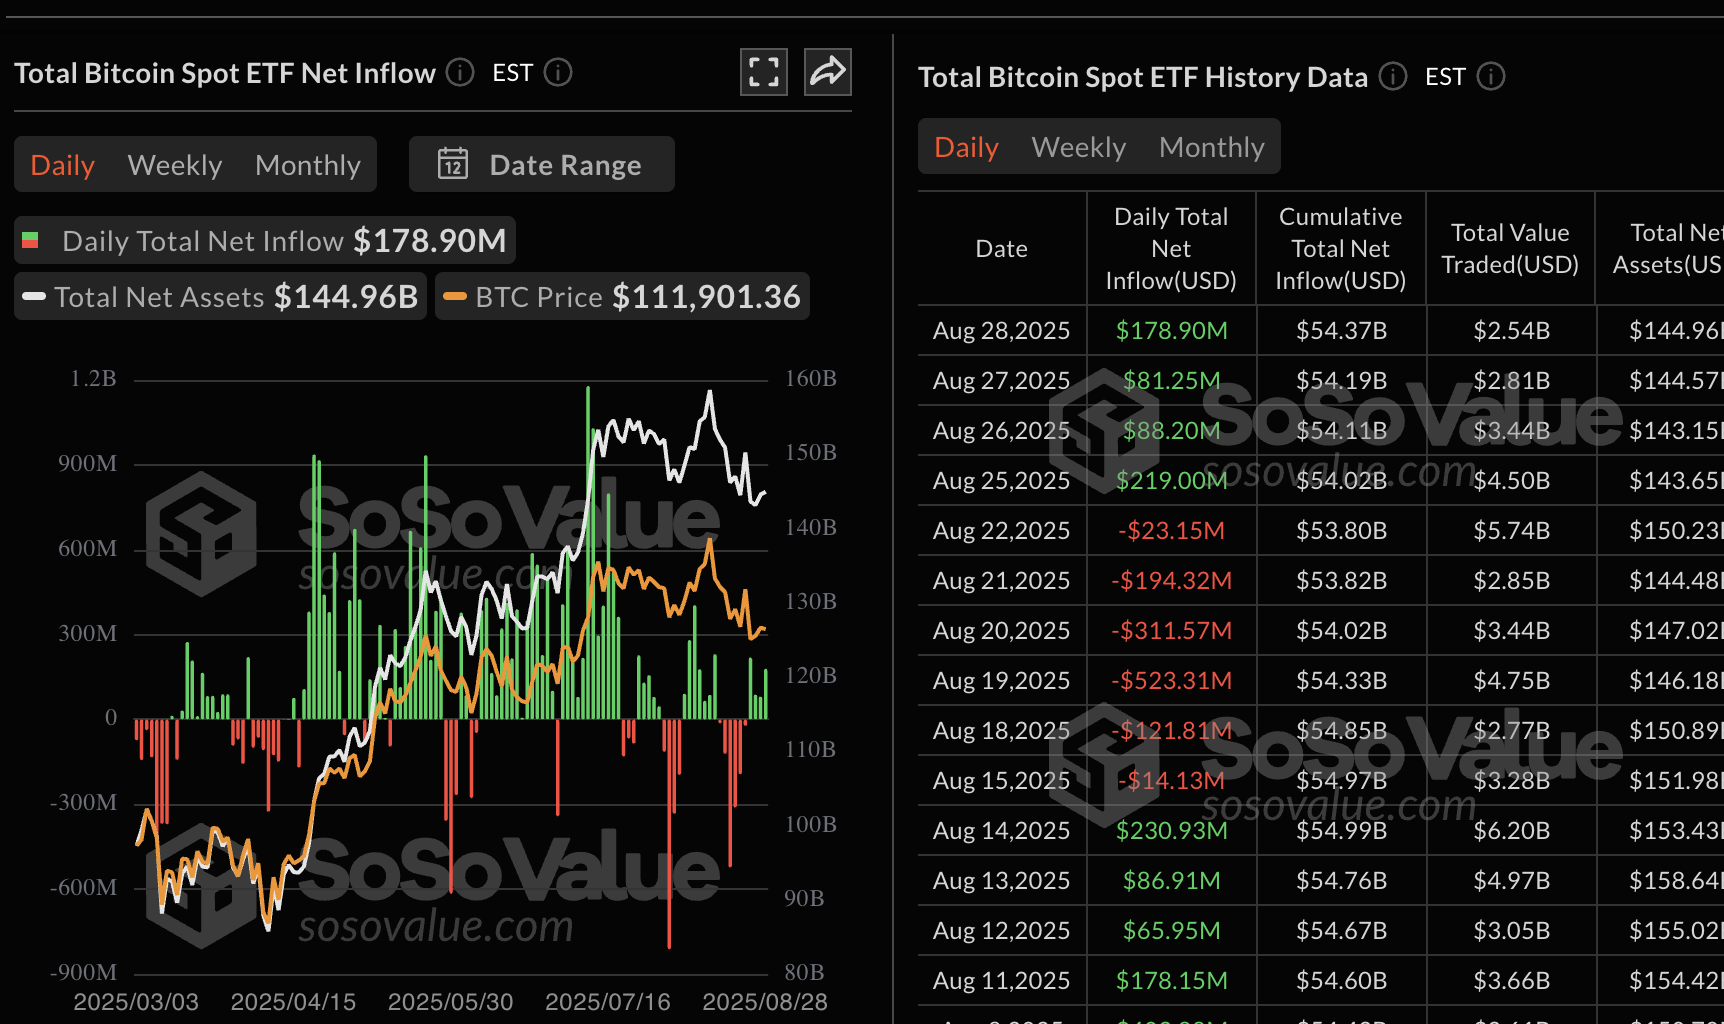
Bitcoin spot ETF data | Source: SoSoValue
Ethereum spot ETFs, on the other hand, extended their six-day bullish streak with $39 million in inflows on Thursday, marking a significant drop from the larger inflows experienced since August 21. Investors will monitor the trend in the coming days to gauge market sentiment ahead of the anticipated Federal Reserve (Fed) interest rate cuts in September.
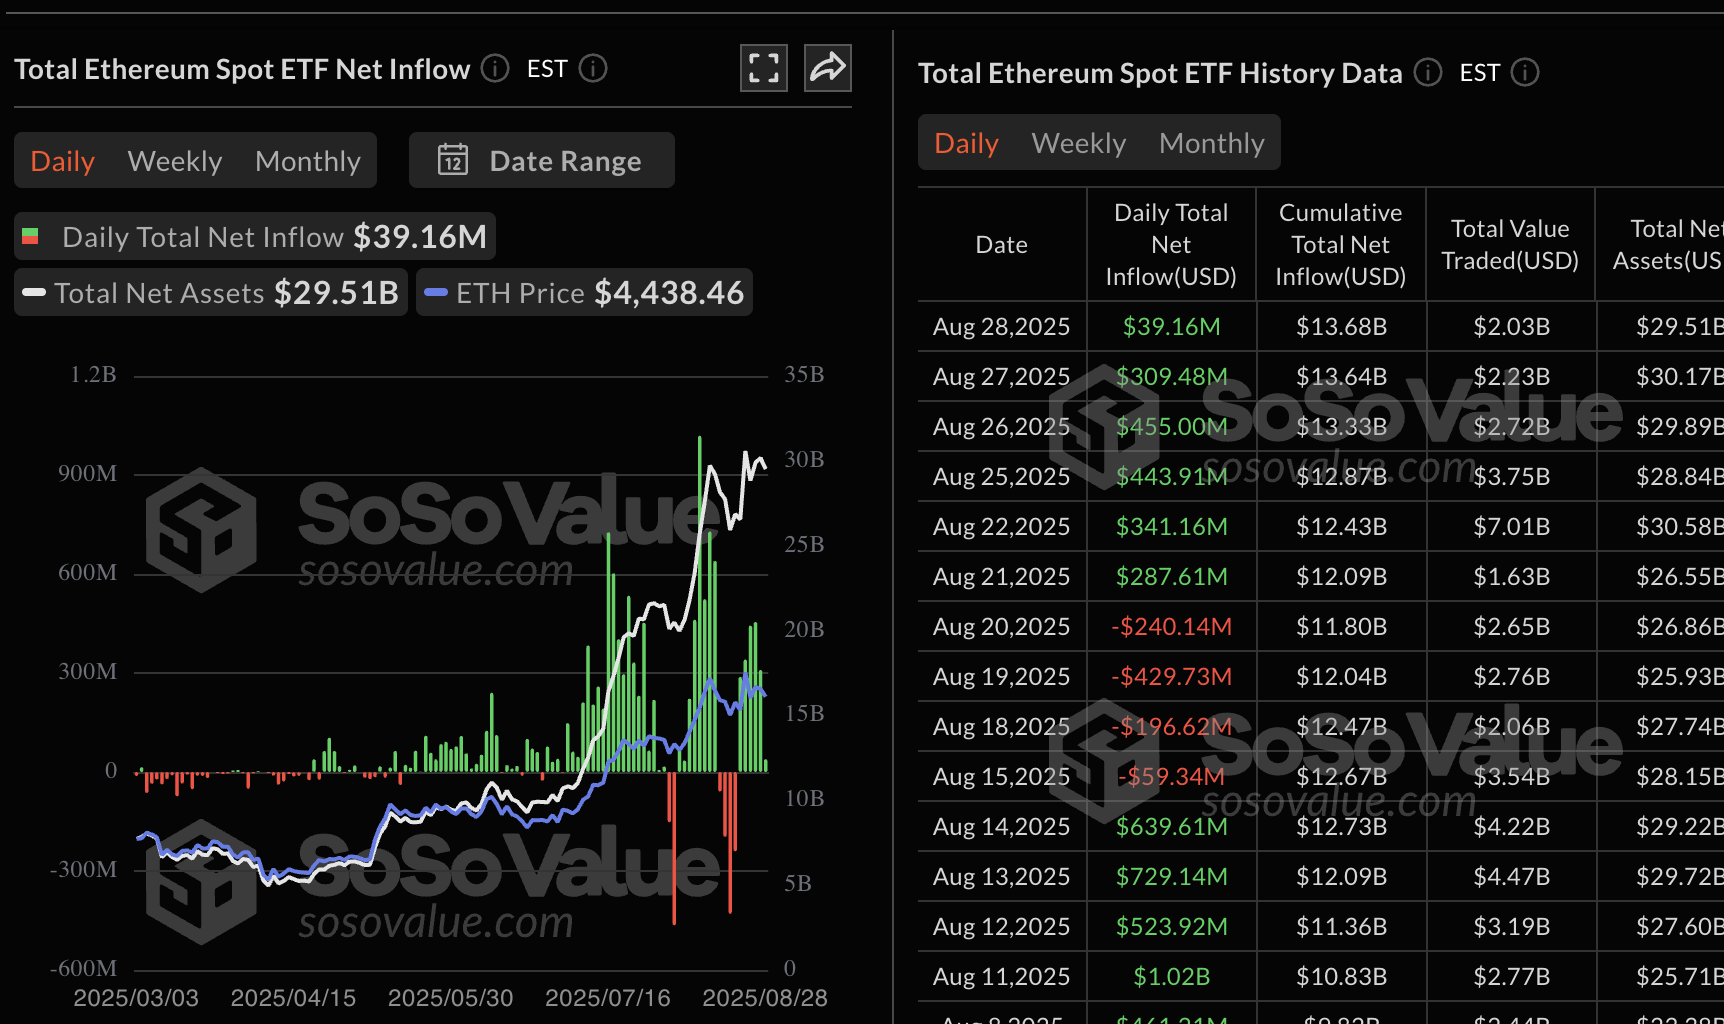
Ethereum spot ETF data | Source: SoSoValue
Chart of the day: Bitcoin slips below $110,000
Bitcoin price has extended its decline below the 100-day Exponential Moving Average (EMA) at $110,852 and the round-figure support level of $110,000. Bearish sentiment prevails in the wider cryptocurrency market, with the Moving Average Convergence Divergence (MACD) indicator on the daily chart showing a sell signal.
If the MACD line in blue holds below the red signal line, the path of least resistance would remain downward as traders are encouraged to close long positions in BTC.
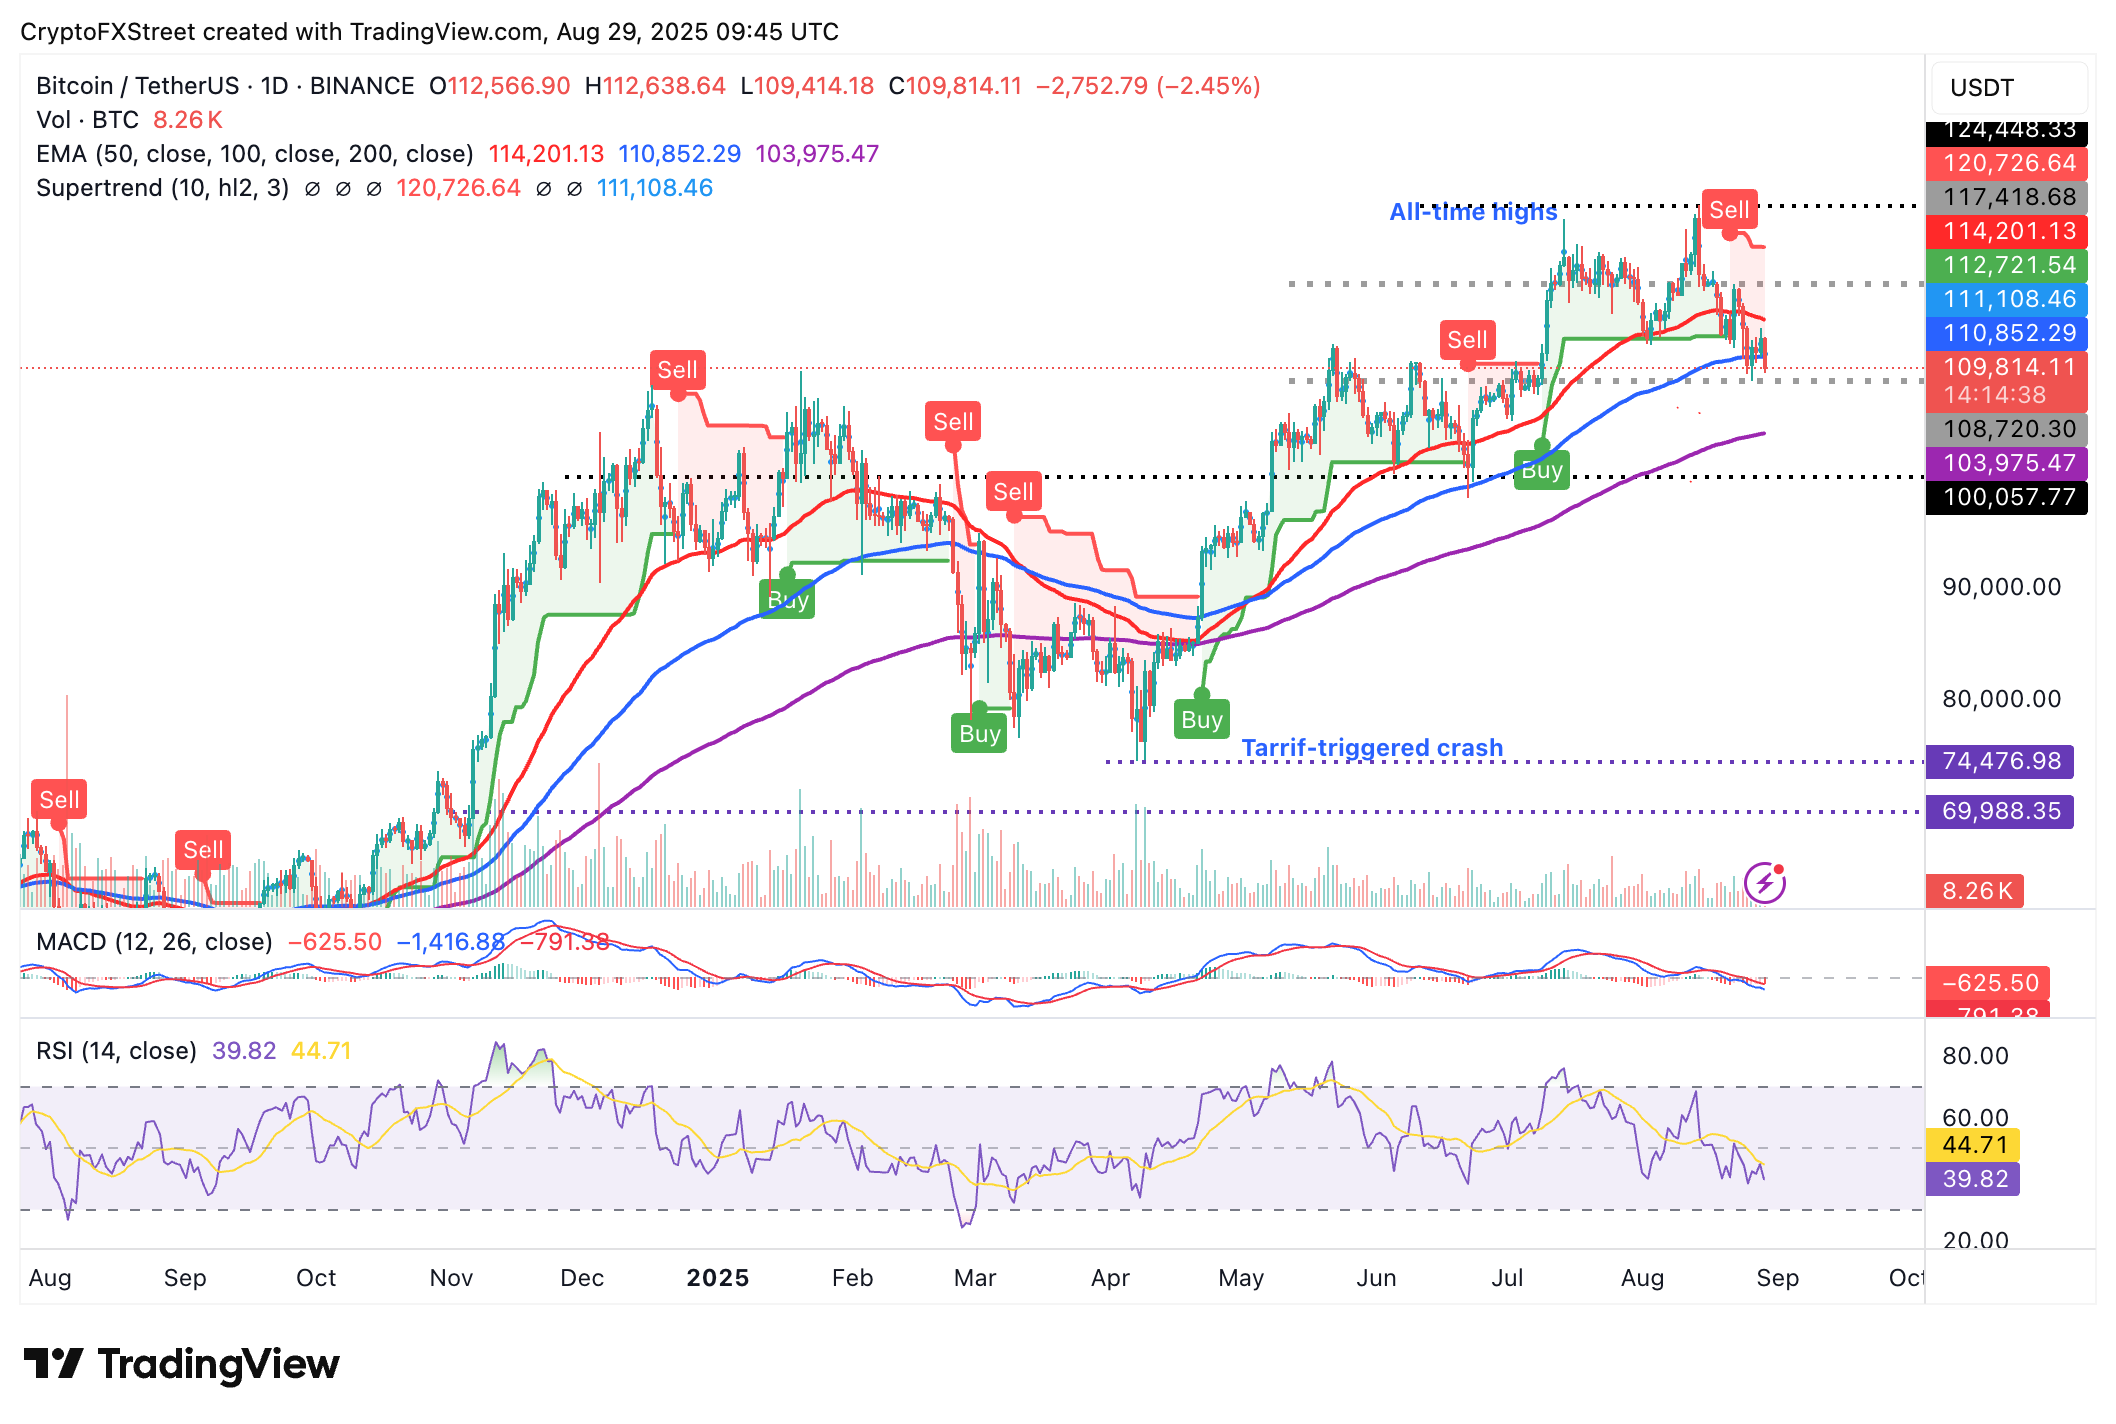
BTC/USDT daily chart
The Relative Strength Index (RSI) at 39 and falling toward oversold territory affirms the bearish outlook and the reduction in buying pressure. Key areas of interest for traders are the 100-day EMA resistance at $110,852, which, if reclaimed, could renew the bullish outlook for a breakout toward $120,000, the weekly support at around $108,500 and the 200-day EMA support at $103,975.
Altcoins update: Ethereum, XRP extend decline
Ethereum price holds above $4,300 at the time of writing as bulls rush to defend support and push for a reversal toward the record high of $4,955. Bears have the upper hand underpinned by a 12% drawdown from the all-time high, a sell signal from the MACD indicator and the RSI as it approaches the midline on the daily chart.
The technical outlook suggests that the path of least resistance is downward, with the Ethereum price targeting the 50-day EMA at $3,952.
A buy signal from the SuperTrend indicator indicates that bulls have a chance to turn the trend upward, targeting a significant move toward a record high above $4,955.
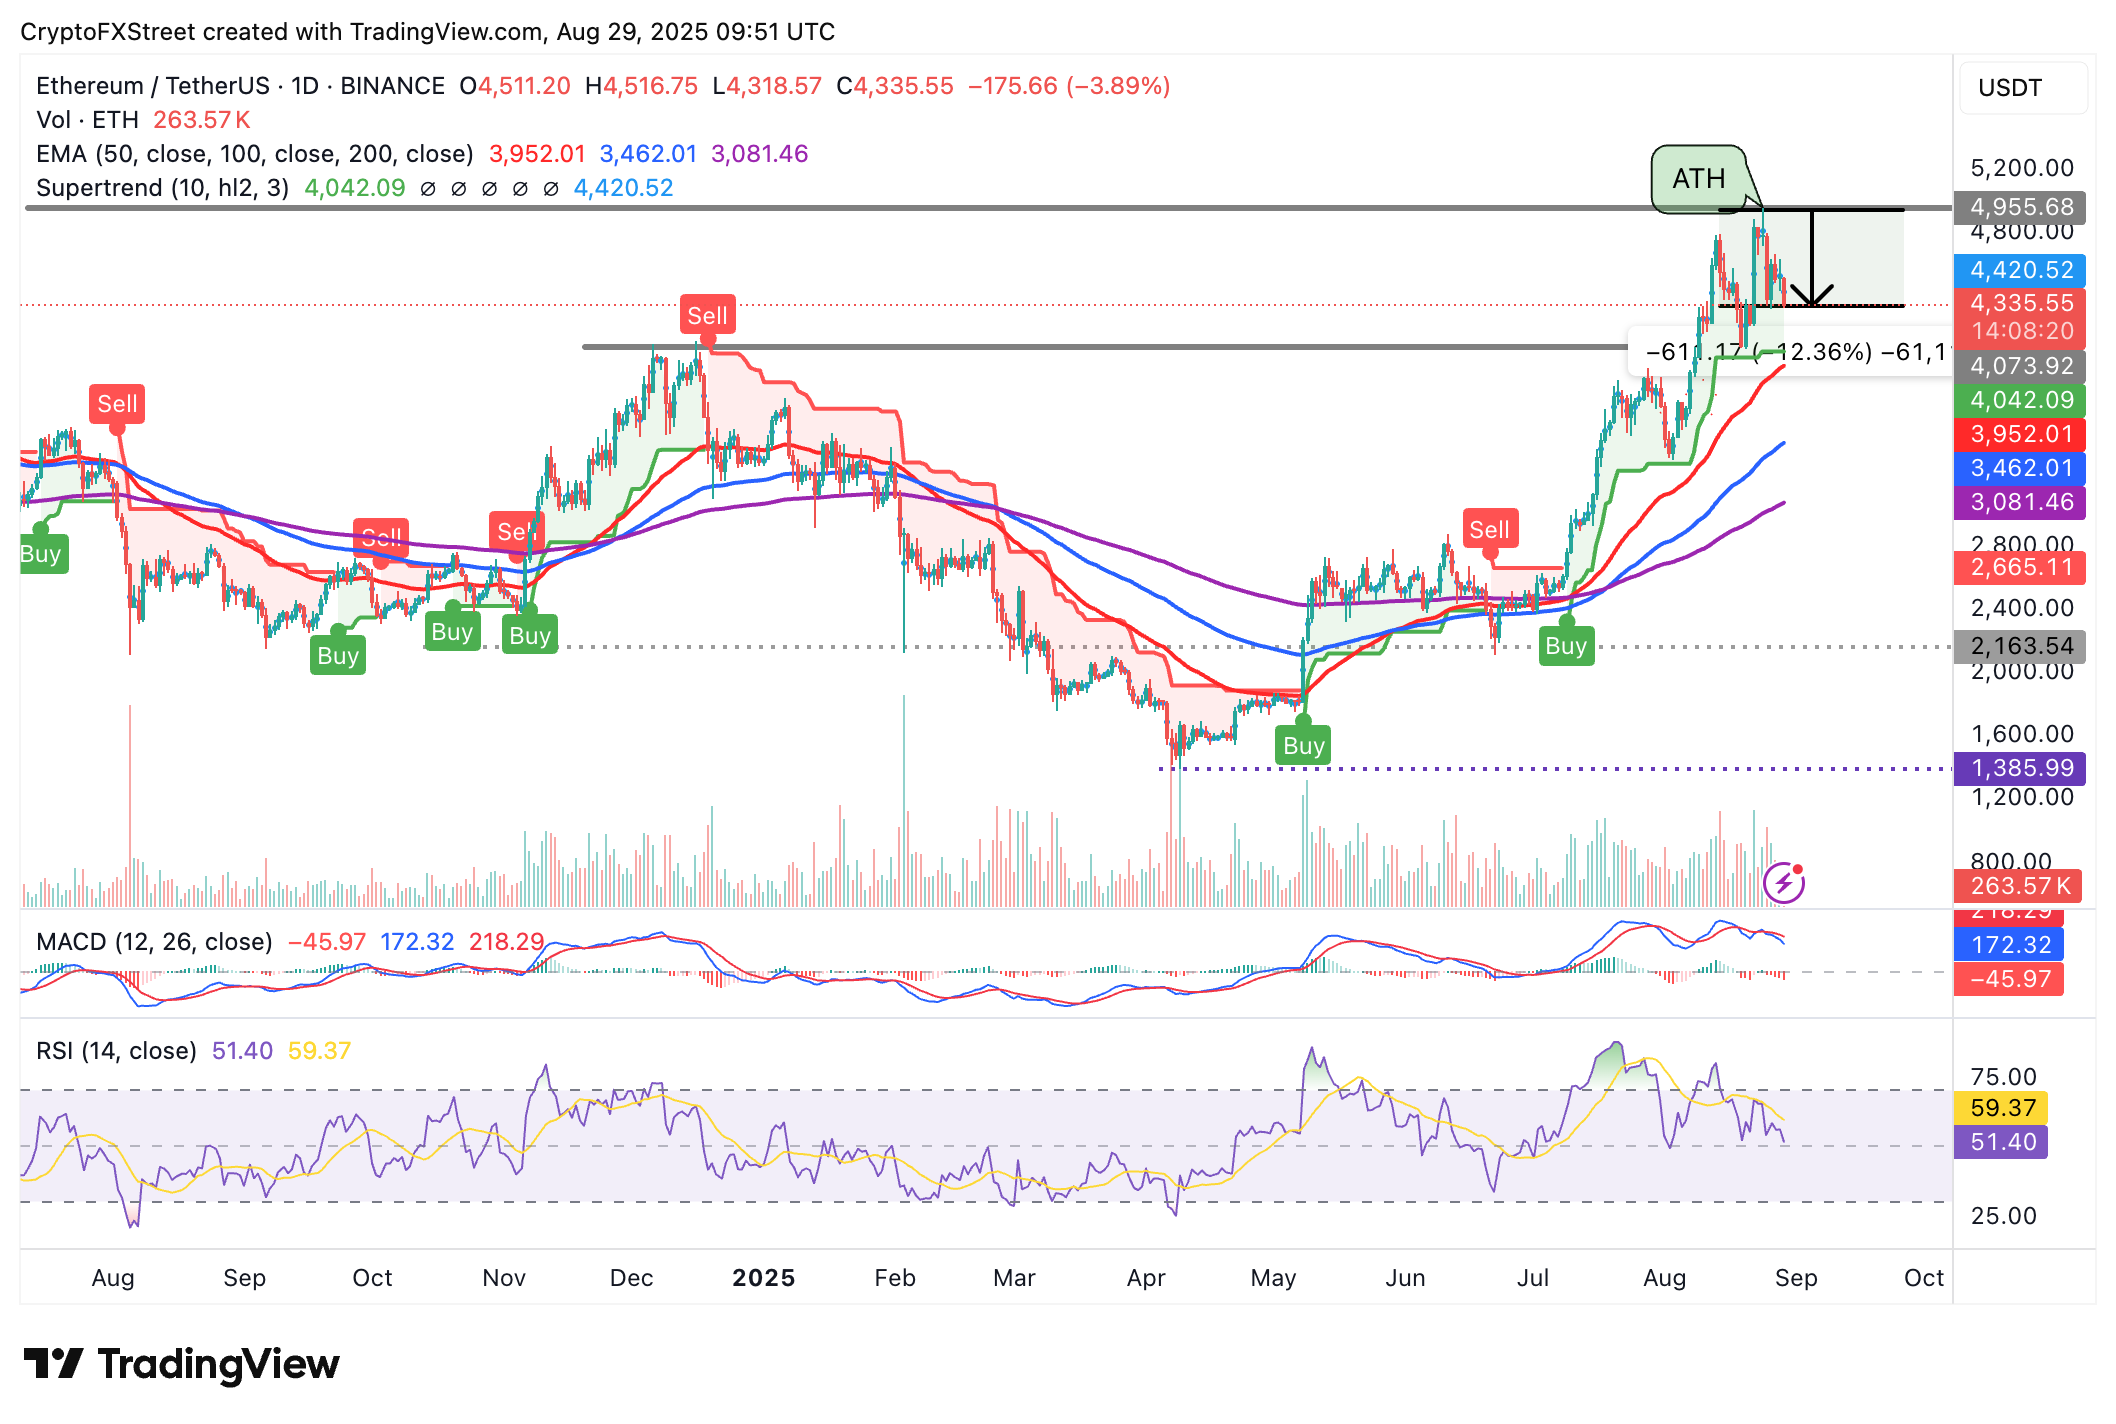
ETH/USDT daily chart
As for XRP, support at $3.00 gave in paving the way for accelerated declines below the 50-day EMA at $2.94. Overhead pressure appears steady, suggesting a risk-off sentiment as traders rush to protect their capital.
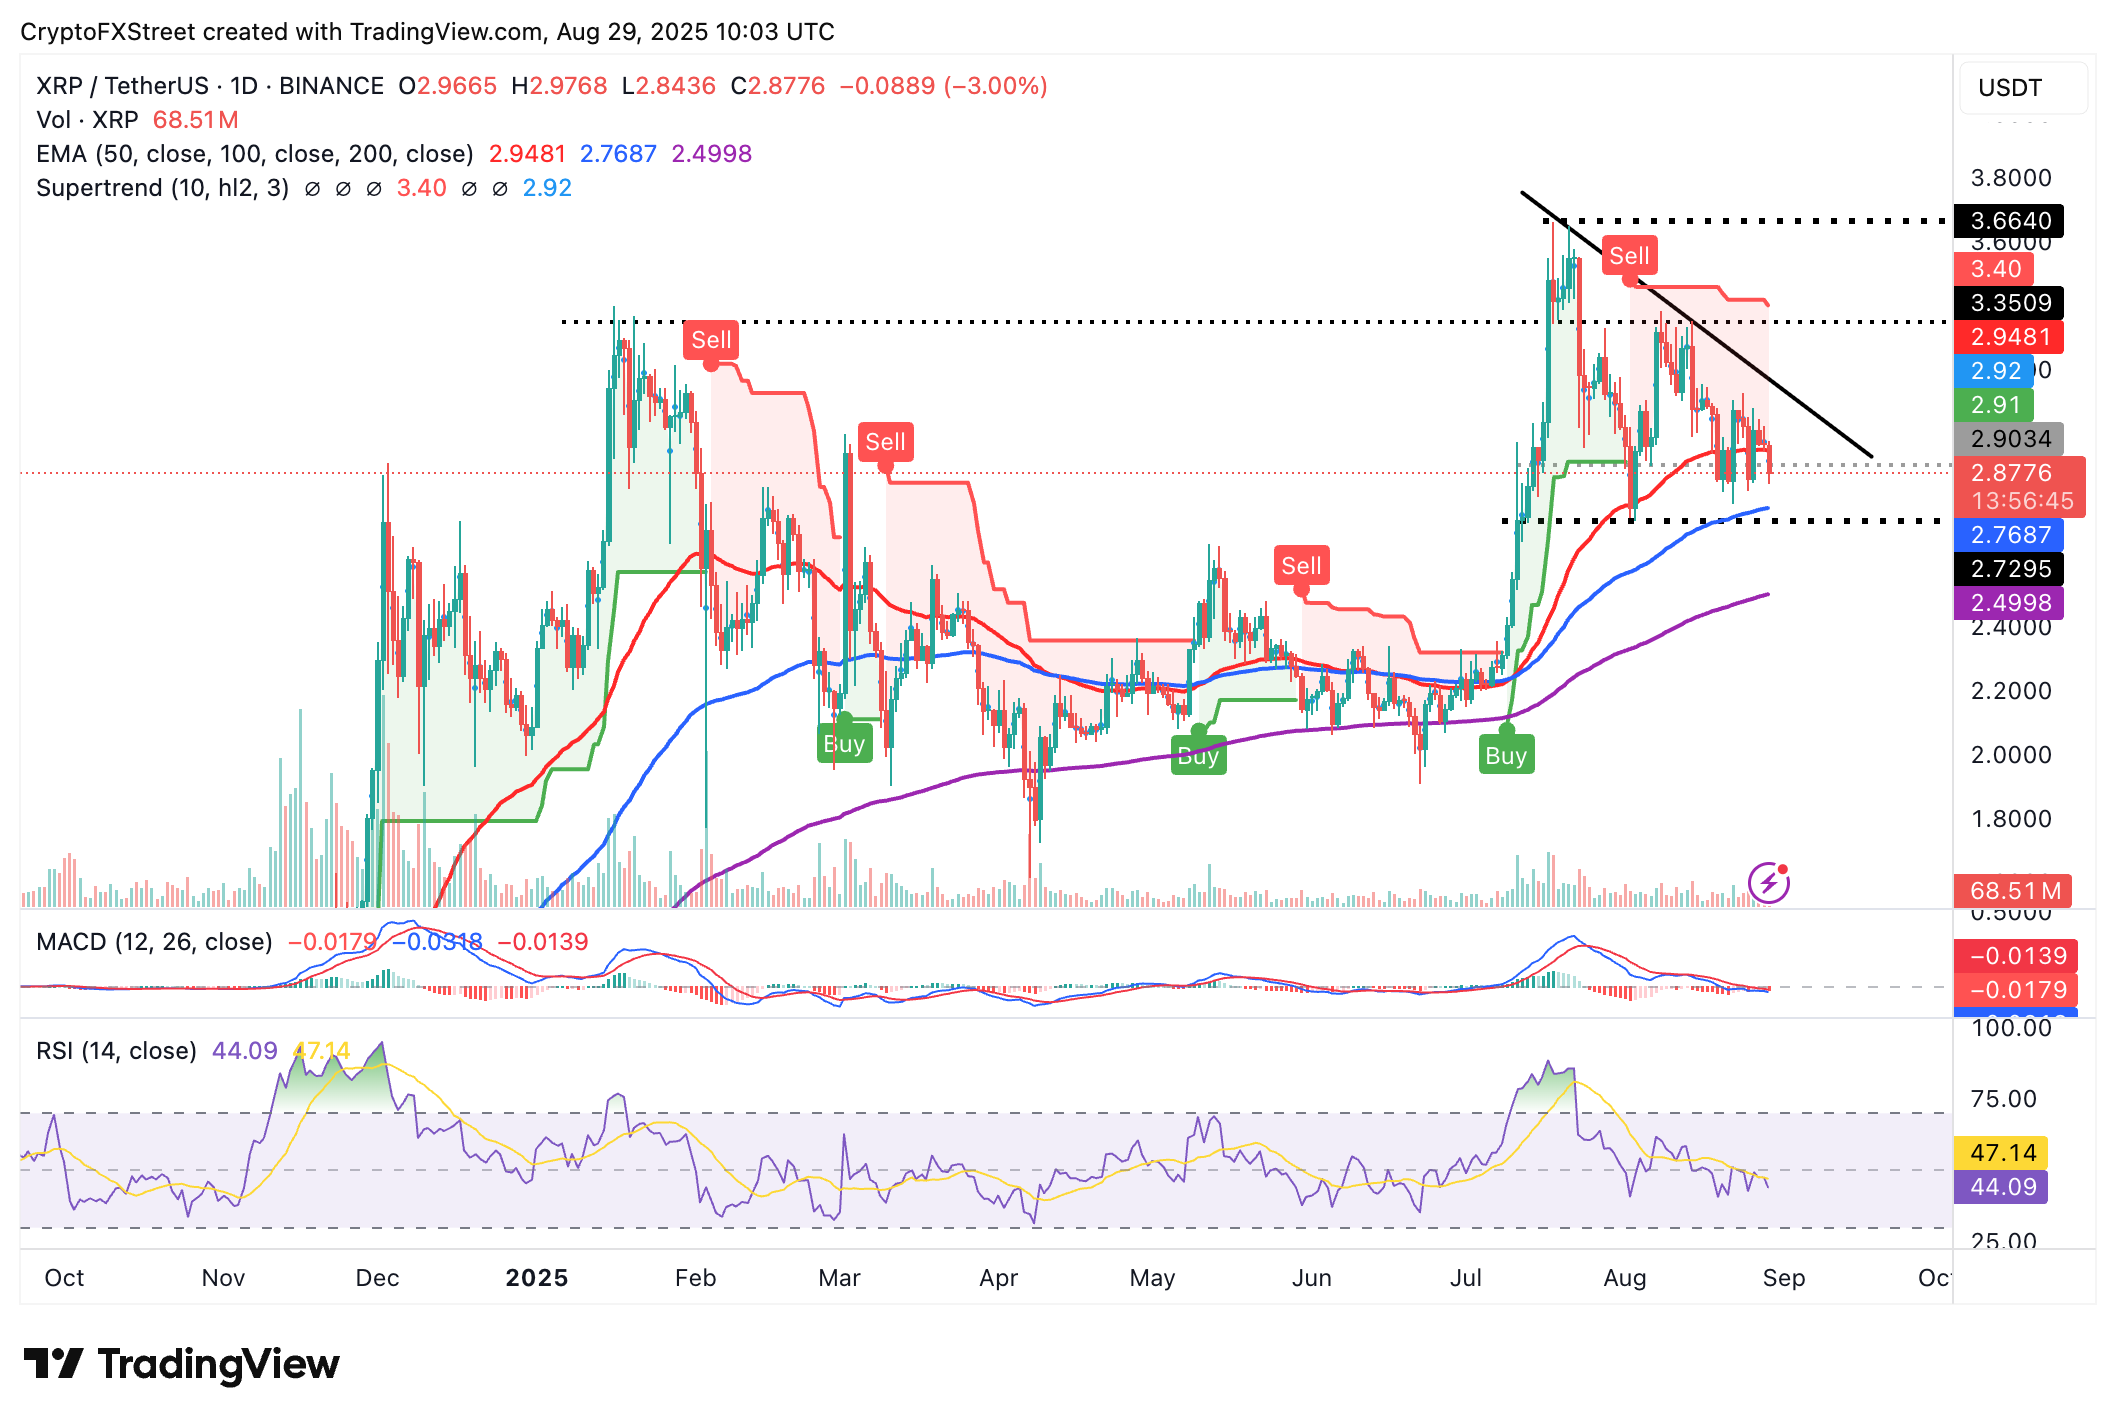
XRP/USDT daily chart
The 100-day EMA at $2.76 is poised to absorb the selling pressure if risk-averse sentiment takes center stage in upcoming sessions. Other key areas of interest to traders are the 200-day EMA at $2.49 and the pivotal $3.00, which, if reclaimed as support, could boost risk on sentiment toward XRP’s $3.66 record high.
Bitcoin, altcoins, stablecoins FAQs
Bitcoin is the largest cryptocurrency by market capitalization, a virtual currency designed to serve as money. This form of payment cannot be controlled by any one person, group, or entity, which eliminates the need for third-party participation during financial transactions.
Altcoins are any cryptocurrency apart from Bitcoin, but some also regard Ethereum as a non-altcoin because it is from these two cryptocurrencies that forking happens. If this is true, then Litecoin is the first altcoin, forked from the Bitcoin protocol and, therefore, an “improved” version of it.
Stablecoins are cryptocurrencies designed to have a stable price, with their value backed by a reserve of the asset it represents. To achieve this, the value of any one stablecoin is pegged to a commodity or financial instrument, such as the US Dollar (USD), with its supply regulated by an algorithm or demand. The main goal of stablecoins is to provide an on/off-ramp for investors willing to trade and invest in cryptocurrencies. Stablecoins also allow investors to store value since cryptocurrencies, in general, are subject to volatility.
Bitcoin dominance is the ratio of Bitcoin's market capitalization to the total market capitalization of all cryptocurrencies combined. It provides a clear picture of Bitcoin’s interest among investors. A high BTC dominance typically happens before and during a bull run, in which investors resort to investing in relatively stable and high market capitalization cryptocurrency like Bitcoin. A drop in BTC dominance usually means that investors are moving their capital and/or profits to altcoins in a quest for higher returns, which usually triggers an explosion of altcoin rallies.
Recommended Articles


