Gold retreats from a five-week high on profit-taking, stronger US Dollar
- Bitcoin Drops to $70,000. U.S. Government Refuses to Bail Out Market, End of Bull Market or Golden Pit?
- Gold rallies further beyond $5,050 amid flight to safety, dovish Fed expectations
- Bitcoin Bottom Debate: $70,000 or $50,000?
- A Crash After a Surge: Why Silver Lost 40% in a Week?
- Bitcoin Slips Below 75,000 Mark. Will Strategy Change Its Mind and Sell?
- Bitcoin Rout. Bridgewater Founder Dalio Publicly Backs Gold.

Gold price declines in Friday’s Asian session.
Profit-taking and a firmer US Dollar undermine the Gold price, but rising Fed rate cut expectations might limit its losses.
Traders will closely monitor the US July PCE inflation report later on Friday.
The Gold price (XAU/USD) edges lower during the Asian trading hours on Friday. The yellow metal retreats from near a five-week high of $3425 in the previous session amid some profit-taking. Additionally, the upbeat US economic data, including the US Gross Domestic Product (GDP) and weekly Initial Jobless Claims data, provide some support to the US Dollar (USD) and weigh on the USD-denominated commodity price.
Nonetheless, rising bets that the US Federal Reserve (Fed) will cut interest rates in the September meeting and dovish remarks from New York Fed chief John Williams might underpin the precious metal. Lower interest rates could reduce the opportunity cost of holding Gold.
The release of the US Personal Consumption Expenditures (PCE) Price Index report for July will take center stage later on Friday. The headline PCE is projected to show an increase of 2.6% YoY in July, while the core PCE is estimated to show a rise of 2.9% during the same period.
Daily Digest Market Movers: Gold drops ahead of key US PCE inflation data
The US GDP grew at an annual rate of 3.3% in Q2, compared to the initial estimate of 3.0%, the US Bureau of Economic Analysis (BEA) showed Thursday. This figure came in better than the estimation of 3.1%.
The US Initial Jobless Claims for the week ending August 23 declined to 229K versus 234K prior (revised from 235K). This reading came in below the market consensus of 230K.
New York Fed President John Williams said on Wednesday that it is likely interest rates can fall at some point, but policymakers will need to see what upcoming data indicate about the economy to decide if it is appropriate to make a cut next month.
Traders are currently pricing in nearly an 85% possibility of a quarter-point Fed rate cut next month, according to the CME FedWatch tool.
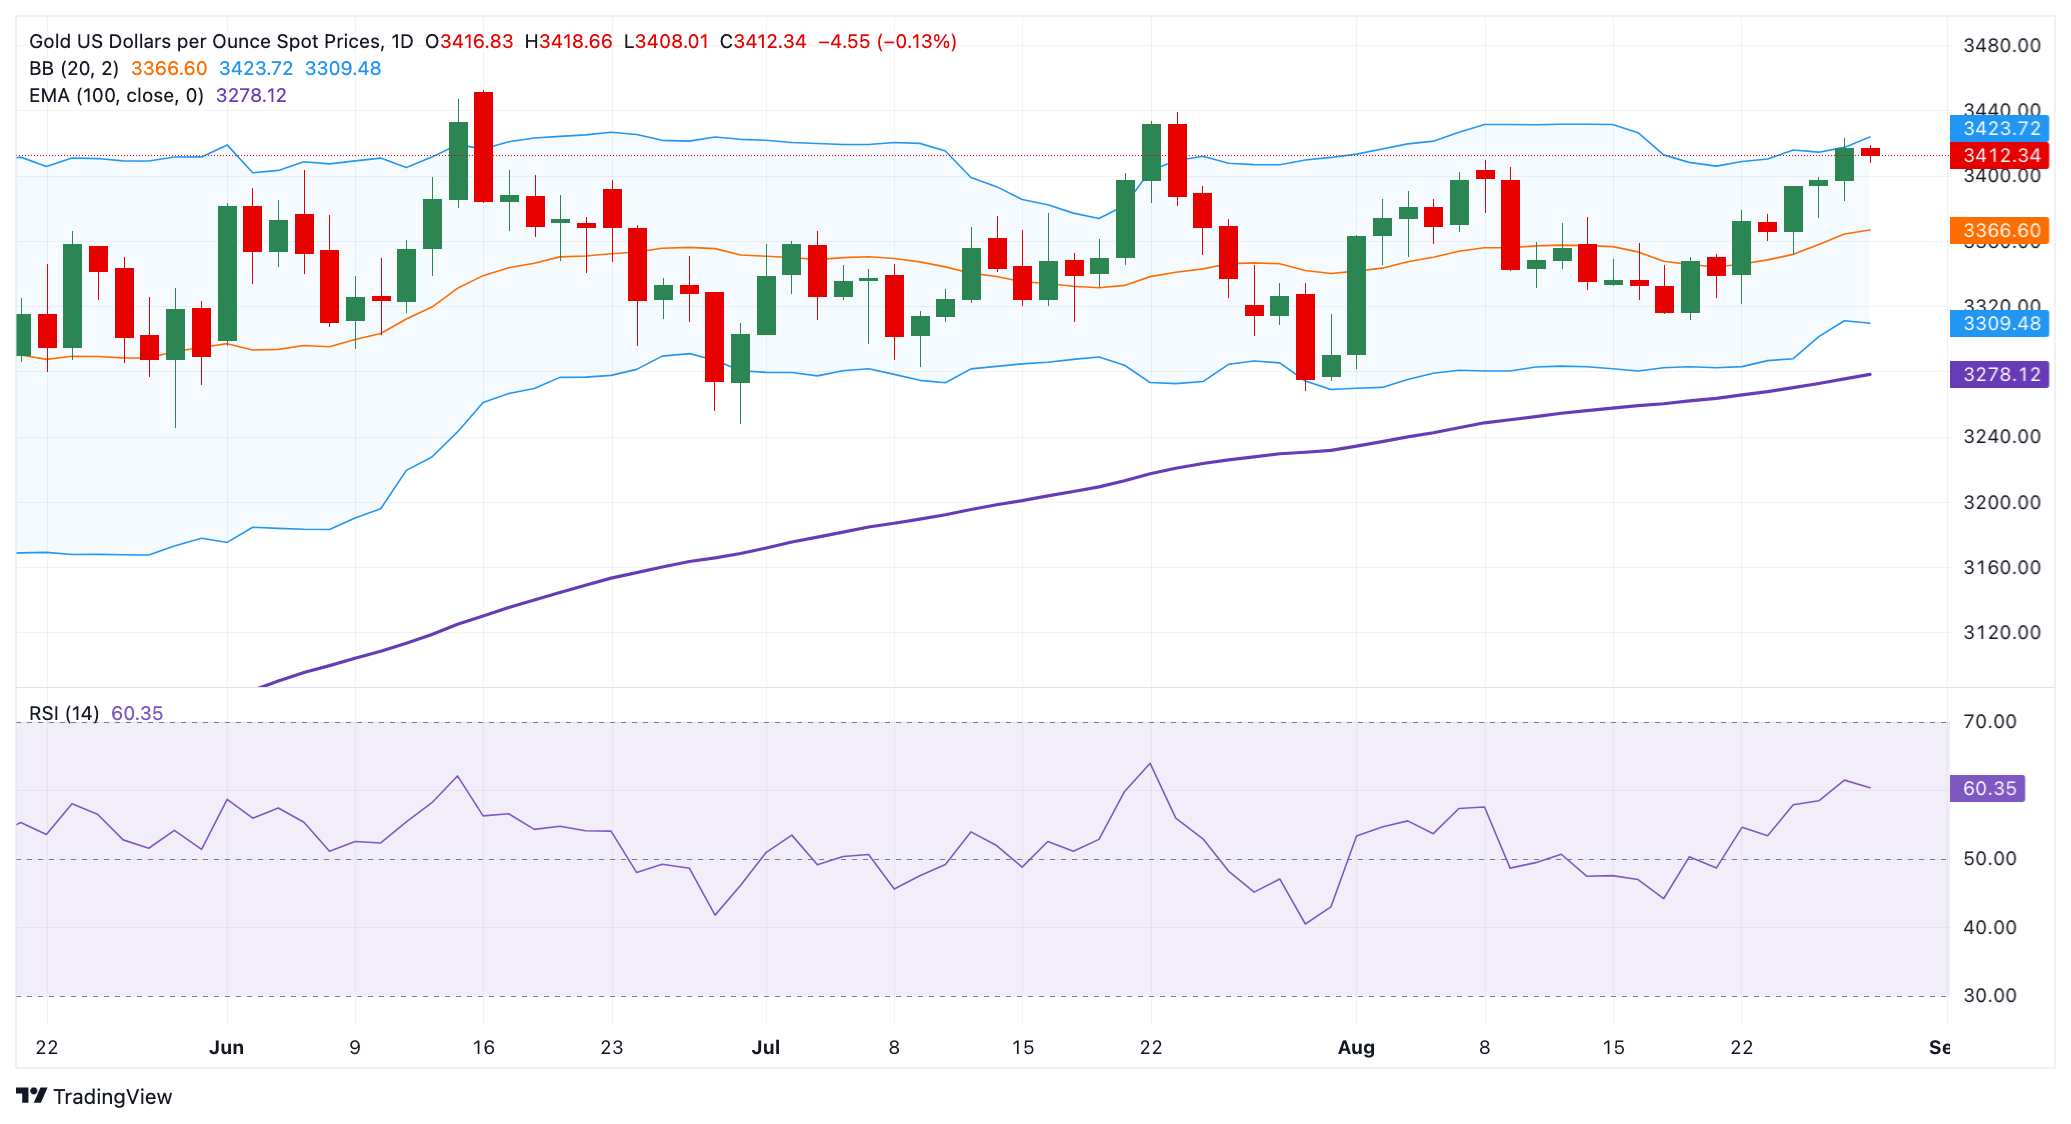
Gold's constructive outlook prevails above the 100-day EMA.
The Gold price trades in negative territory on the day. The bullish tone of the precious metal remains intact in the longer term, with the price holding above the key 100-day Exponential Moving Average (EMA) on the daily chart. The upward momentum is supported by the 14-day Relative Strength Index (RSI), which stands above the midline near 60.50. This displays the bullish momentum in the near term.
The upper boundary of the Bollinger Band of $3,425 acts as an immediate resistance level for XAU/USD. Sustained trading above this level could take the yellow metal to $3,439, the high of July 23. The next upside target to watch is $3,500, the psychological level and the high of April 22.
On the downside, the initial support level for Gold is seen at $3,373, the low of August 27. Red candlesticks closing below the mentioned level could expose $3,351, the low of August 26. The additional downside filter is located at $3,310, the lower limit of the Bollinger Band.

Read more
* The content presented above, whether from a third party or not, is considered as general advice only. This article should not be construed as containing investment advice, investment recommendations, an offer of or solicitation for any transactions in financial instruments.


