

Bitcoin Price Outlook: Will BTC drop amid skyrocketing realized profit among long-term holders?
- Bitcoin price topped out at $71,561 on Binance, unable to reclaim its March peak of $73,777.
- The long-term holder cohort has ramped up their overall distribution pressure amid surging realized profit.
- With such significant profits in play, balance between reaping profits and ensuring long-term sustainability has traders at a crossroads.
Bitcoin (BTC) price in a measure of strength has recovered from the $62,000 range, reclaiming the $69,000 threshold after suffering the aftermath of a slowdown in inflows from spot BTC exchange-traded funds (ETFs). Will the bullishness sustain itself, or is the pioneer cryptocurrency preparing markets for yet another buying opportunity?
Also Read: ETNs, not ETFs, send Bitcoin price back above 70K as LSE plans to launch BTC and ETH markets
Bitcoin long-term holders ramp up distribution pressure
Bitcoin price is oscillating between the $69,000 and $70,700 range after a remarkable recovery from the $62,000 range. The dump had provided a buying opportunity for bulls that missed the early March rally.
However, according to Glassnode analysts, the long-term holder cohort for BTC investors is ramping up their overall distribution pressure. The report ascribes this to skyrocketing realized profit, recording upwards of $2.6 billion per day in realized profit as they cash in on the gains made.
As the #Bitcoin market hits resistance at a new ATH of $73k, the Long-Term Holder cohort have ramped up their overall distribution pressure.
— glassnode (@glassnode) March 26, 2024
The market is currently seeing over $2.6B/day in realized profit, as investors start to take chips off the table.
Discover more in the… pic.twitter.com/YHXRnbUnFR
Distribution pressure is when token holders exert selling pressure on the asset. As these traders look to sell their holdings, it can lead to downward price movements. It coincides with heightened realized profit, meaning there is an increased number of Bitcoin holders who are able to sell their coins at a profit compared to when they acquired them. This could lead to:
- Profit-taking by long-term holders after seeing a significant rise in profits
- Increased volatility with more traders looking to take profits, causing fluctuations in price as buy and sell orders are executed
Meanwhile, analyst @CryptoCapo_ on X observes that there remains a significant liquidity zone in the BTC market, extending between $74,000 and $75,000. Within this price range, enough buyers and sellers are present and potentially could facilitate quick and efficient trades without causing drastic price movements.
Update.$BTC bounced from support and it is nearing the $74k-75k liquidity zone. However, those levels could be front-run because the volume is decreasing (especially spot volume is not matching the move), price is moving against supply, and the funding rates are increasing very… https://t.co/umNl8rVrC5 pic.twitter.com/ukbHWVp67M
— il Capo Of Crypto (@CryptoCapo_) March 26, 2024
For the layperson, traders often look for liquidity zones to place their buy or sell orders, as it can help them enter or exit positions more easily. Liquidity zones can also act as levels of support or resistance, influencing price movements as traders interact within those ranges.
Bitcoin price outlook as BTC investors start to take chips off the table
Bitcoin price remains bullish, but volatility is rising as the number of BTC holders in the realized profit category remains high. If Bitcoin price is able to close above the $69,000 threshold on the 4-hour timeframe, it could continue north to reclaim the $73,777 peak recorded earlier in the month.
Clearing the $73,777 all-time high could set the tone for a foray into the liquidity zone above $74,000. Such a move could encourage more buy orders among BTC bulls, propelling BTC price further north.
The Moving Average Convergence Divergence (MACD), holding above the orange band of the signal line is a bullish sign, indicating the market is still optimistic.
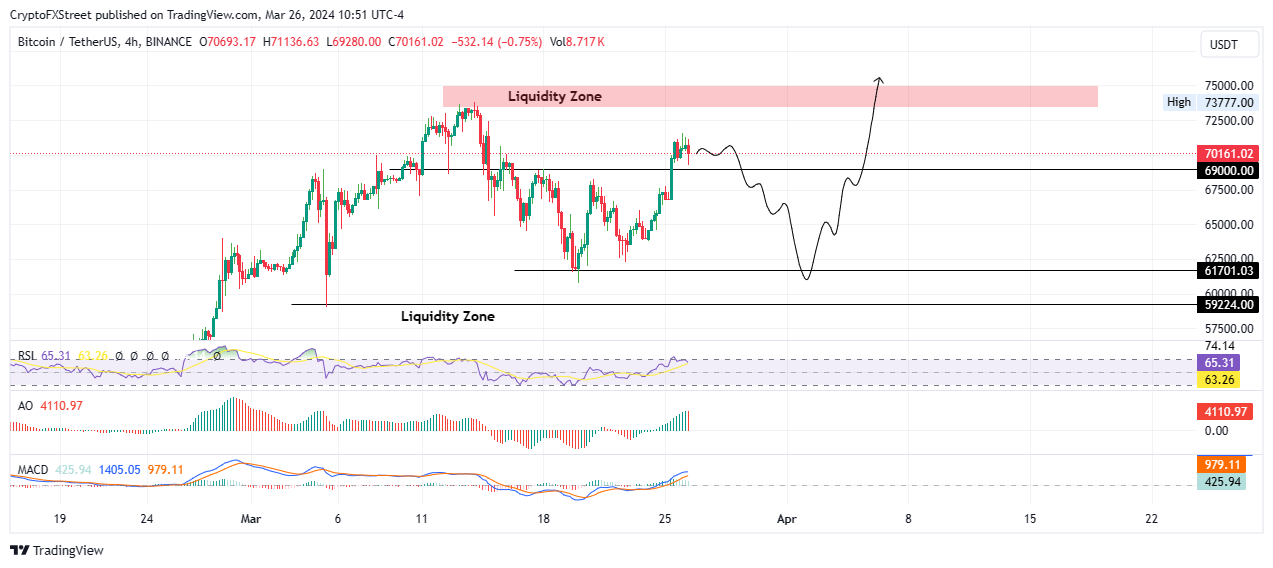
BTC/USDT 4-hour chart
Nevertheless, the immediate upside potential for Bitcoin price is threatened as the Relative Strength Index (RSI) is failing to show that buying pressure is dropping. If the RSI crosses below the yellow band of its signal line, the downtrend could solidify.
This could send BTC price below $69,000, or stomp it back to the $62,000 range, with likely support at $61,701. In a dire case, Bitcoin price could fall into the liquidity zone below $59,224 support.
Besides the RSI, the histograms of the Awesome Oscillator (AO) display red histogram bars, suggesting growing bearish sentiment. With this, analysts anticipate negative price action.
#Bitcoin Big buys and sells sitting on both sides.
— Daan Crypto Trades (@DaanCrypto) March 26, 2024
Good chance eventually both of theses get filled if they don't get pulled earlier.
Price tends to look for these orders (liquidity) sooner or later. pic.twitter.com/uxZtqcY9cb
As buyer momentum counters selling pressure, the balance between booking profits and ensuring long-term sustainability becomes apparent.
Cryptocurrency metrics FAQs
The developer or creator of each cryptocurrency decides on the total number of tokens that can be minted or issued. Only a certain number of these assets can be minted by mining, staking or other mechanisms. This is defined by the algorithm of the underlying blockchain technology. Since its inception, a total of 19,445,656 BTCs have been mined, which is the circulating supply of Bitcoin. On the other hand, circulating supply can also be decreased via actions such as burning tokens, or mistakenly sending assets to addresses of other incompatible blockchains.
Market capitalization is the result of multiplying the circulating supply of a certain asset by the asset’s current market value. For Bitcoin, the market capitalization at the beginning of August 2023 is above $570 billion, which is the result of the more than 19 million BTC in circulation multiplied by the Bitcoin price around $29,600.
Trading volume refers to the total number of tokens for a specific asset that has been transacted or exchanged between buyers and sellers within set trading hours, for example, 24 hours. It is used to gauge market sentiment, this metric combines all volumes on centralized exchanges and decentralized exchanges. Increasing trading volume often denotes the demand for a certain asset as more people are buying and selling the cryptocurrency.
Funding rates are a concept designed to encourage traders to take positions and ensure perpetual contract prices match spot markets. It defines a mechanism by exchanges to ensure that future prices and index prices periodic payments regularly converge. When the funding rate is positive, the price of the perpetual contract is higher than the mark price. This means traders who are bullish and have opened long positions pay traders who are in short positions. On the other hand, a negative funding rate means perpetual prices are below the mark price, and hence traders with short positions pay traders who have opened long positions.
Recommended Articles


