


Ethereum Faces Historic Short Interest: Rally Could Trigger Massive Liquidations
Ethereum is under pressure as volatility spikes, with the price recently slipping below the $4,300 mark. After weeks of strong momentum and multi-year highs, bulls are now struggling to defend support zones. The loss of this level raises concerns about a potential deeper correction, though fundamentals remain firmly bullish.
Institutional adoption continues to provide strong tailwinds, with major firms increasing exposure to Ethereum through ETFs, treasury strategies, and on-chain accumulation. This steady demand reflects growing confidence in ETH’s long-term role within the digital asset ecosystem. At the same time, Open Interest has been rising sharply, highlighting a surge in speculation and leveraged positioning across derivatives markets. While this can amplify moves in both directions, it underscores the intense battle between bulls and bears at current levels.
Market participants now see the coming days as critical for Ethereum’s short-term trajectory. Holding above nearby support could pave the way for a rebound and renewed attempts to challenge the $4,500–$4,800 resistance zone.
Ethereum Faces Record Short Position Pressure
Ethereum is entering one of its most decisive moments yet, with unprecedented short positioning building up in the market. According to top analyst Ted Pillows, we’re witnessing the biggest leveraged short position on ETH ever recorded. Net leveraged shorts have climbed to 18,438 contracts, marking the biggest bearish bet in Ethereum’s history. This surge in positioning reflects a market bracing for volatility, as traders place aggressive downside bets following Ethereum’s retrace from the $4,790 level.
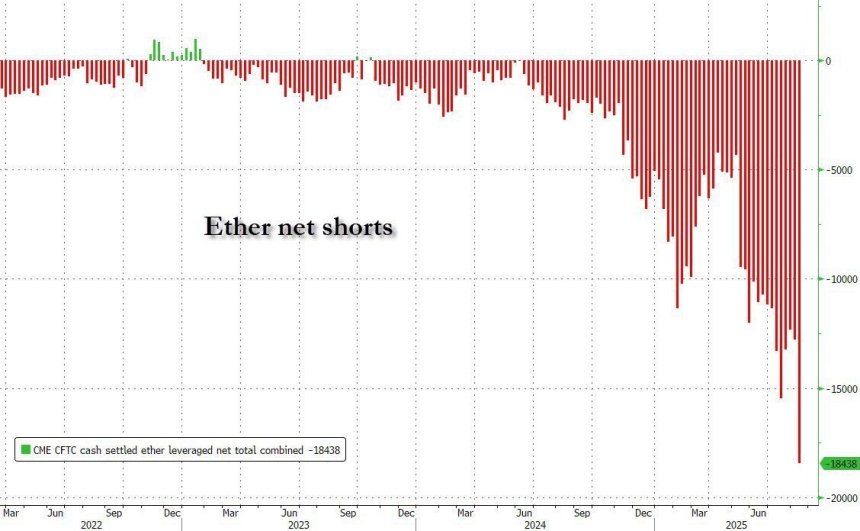
However, Pillows emphasizes that this dynamic could create the perfect storm for a short squeeze. If Ethereum manages to rally from current levels, these bearish positions could quickly unwind, forcing shorts to cover at higher prices and accelerating the rally. Historically, such imbalances have led to explosive upside moves in a short timeframe, catching bears off guard and rewarding bulls with rapid gains.
While short-term volatility remains elevated, strong fundamentals — including declining exchange supply, institutional accumulation, and broader adoption trends — continue to support the long-term bullish thesis. For now, all eyes remain on whether the record-short positioning turns into the catalyst for Ethereum’s next breakout.
ETH Technical Details: Testing Demand LevelEthereum is currently trading at $4,284, showing signs of volatility after its recent decline from the $4,800 region. The 4-hour chart highlights how ETH has struggled to reclaim momentum, with price now testing a key support zone around the $4,200–$4,250 range. This level is crucial because it aligns with the 100-day moving average (green line), which has acted as dynamic support during previous pullbacks in this rally.
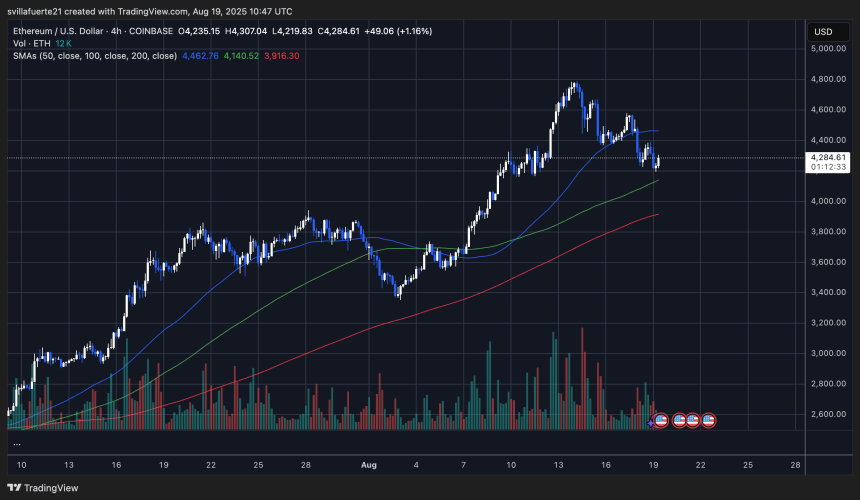
The price structure shows that bulls remain active but are under pressure. After weeks of consistent gains, Ethereum is now experiencing heavier selling volume, as visible in the recent red bars on the chart. However, the broader trend remains bullish as long as ETH holds above the 200-day moving average (red line), currently sitting below $3,920.
A breakdown of $4,200 could expose ETH to further downside toward $4,000 or even $3,900 in the short term. On the other hand, if buyers defend this zone, Ethereum could attempt another rally to retest resistance levels around $4,500–$4,600.
Featured image from Dall-E, chart from TradingView
Recommended Articles


