

Bitcoin SOPR Shows Potential Entry Zones: Short-Term Holders Face Pressure

Source Newsbtc

Bitcoin is trading around the $115,000 level after a sharp pullback from its recent all-time high near $124,000. Volatility has returned to the market, sparking renewed debate among analysts and investors over whether BTC is preparing for a deeper correction or gearing up for the next leg higher. The current price action reflects indecision, with buyers and sellers locked in a tight battle at these critical levels.

Some analysts warn that Bitcoin could face stronger selling pressure if it fails to reclaim momentum, while others argue that this retrace is a healthy reset before another aggressive move upward. What is clear, however, is that investors are preparing for heightened market swings in the coming weeks.

Key on-chain data reveals that short-term holders (STHs) remain under pressure. Since November and December of 2024, the average profit realized by this group has not exceeded 5%. This means their Spent Output Profit Ratio (SOPR) has stayed below 1.05, signaling that many recent market entrants have struggled to lock in meaningful gains. Historically, this kind of stagnation in STH profitability has preceded major directional moves, suggesting that Bitcoin may be on the verge of its next decisive phase.

Bitcoin Short-Term Holders Under Pressure

Top analyst Darkfost has provided a fresh take on Bitcoin’s current market structure, focusing on the behavior of short-term holders (STHs) through the lens of the Spent Output Profit Ratio (SOPR). The SOPR measures the average profit or loss realized when a UTxO is spent, making it one of the most reliable gauges of investor profitability and selling behavior.
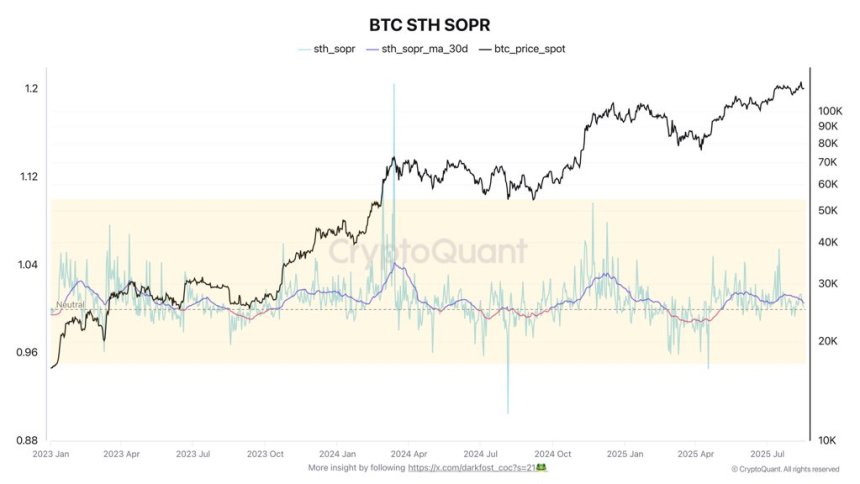
Bitcoin STH SOPR | Source: Darkfost

At present, the STH SOPR remains stuck at the neutral ratio of 1. This means that, on average, recent market entrants are breaking even on the coins they sell, rather than realizing a profit or a loss. According to Darkfost, this suggests that many STHs entered the market late, likely during Bitcoin’s push above $100,000 over the past six months. As a result, they now find themselves in a holding pattern, waiting for price appreciation to secure meaningful returns.

Darkfost emphasizes that in bull markets, these dynamics often follow a predictable pattern. When STHs are shaken out, their SOPR typically dips below 1, reflecting selling at a loss. Historically, such phases have created attractive dollar-cost averaging (DCA) opportunities, as capitulation from weaker hands clears the way for stronger upward trends.

Bitcoin Price Analysis: Key Levels in Focus

Bitcoin is currently trading near $115,133, after pulling back sharply from the recent peak at $124,000. The chart shows that BTC has broken away from its mid-summer consolidation, but momentum has cooled, with price now testing support around the 50-day moving average ($115,712). This level will be critical in the short term, as a sustained breakdown could open the way toward the 100-day moving average near $110,833.
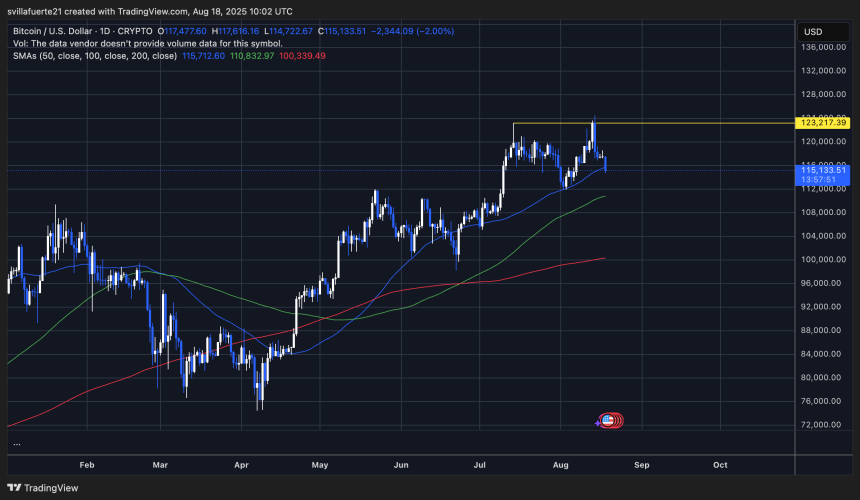
BTC testing key moving average | Source: BTCUSDT chart on TradingView

Despite the recent decline, the broader structure remains constructive. Bitcoin has spent much of the past six months above the psychological $100,000 level, establishing strong long-term support. The rejection near $123,217, marked by the yellow resistance line, suggests that bulls will need more conviction to push BTC into new highs. A clean breakout above that level could quickly send the price toward the $130,000–$135,000 region.

On the downside, the 200-day moving average ($100,339) remains the ultimate line of defense. As long as BTC stays above this level, the broader bull trend remains intact.

Featured image from Dall-E, chart from TradingView

Disclaimer: For information purposes only. Past performance is not indicative of future results.
placeholder
Today’s Market Recap: U.S. Stocks Rebound as Nasdaq Gains 1.11%, Memory Chip Stocks Rally, SanDisk Jumps 5.5%U.S. stocks rebounded on Monday, October 19, following a sharp sell-off in AI infrastructure stocks last week, lifting the Nasdaq Composite and S&P 500.At the clo
Author  TradingKey
Yesterday 01: 25
U.S. stocks rebounded on Monday, October 19, following a sharp sell-off in AI infrastructure stocks last week, lifting the Nasdaq Composite and S&P 500.At the clo
placeholder
Gold Price Analysis Today | Forex Gold Analysis | XAU/USD Analysis - October 20, 2026Get the latest gold price analysis, forex gold insights, and XAU/USD analysis for October 20, 2026. Read on for the details.
Author  Mitrade
23 hours ago
Get the latest gold price analysis, forex gold insights, and XAU/USD analysis for October 20, 2026. Read on for the details.
placeholder
Dollar presses 102 as the 10-year yield sits at 5.14% — and October hike odds are only 17%The dollar index closed at 101.99 (+0.20%) on Monday after briefly topping 102.07, while the 10-year Treasury yield rose to 5.14% and the 2-year hit 4.774% — yet futures price only about a 17% chance of a hike at the October 27-28 FOMC, versus roughly 90% for December. The driver is a global bond selloff, not a Fed repricing: France's 10-year OAT jumped to 4.84% ~ 4.94% and the OAT-Bund spread widened to 140 ~ 146bp. Here are the levels, the cross-asset read-through and what to watch.
Author  Irene Q.
20 hours ago
The dollar index closed at 101.99 (+0.20%) on Monday after briefly topping 102.07, while the 10-year Treasury yield rose to 5.14% and the 2-year hit 4.774% — yet futures price only about a 17% chance of a hike at the October 27-28 FOMC, versus roughly 90% for December. The driver is a global bond selloff, not a Fed repricing: France's 10-year OAT jumped to 4.84% ~ 4.94% and the OAT-Bund spread widened to 140 ~ 146bp. Here are the levels, the cross-asset read-through and what to watch.
placeholder
Netflix earnings land tonight: the $70 line that decides whether the AI rebound has legsNetflix reports Q3 after the US close on October 20 with the stock at $69.85 (-0.96%), just below the $70 round number and far from its 52-week high of $124.86. Consensus looks for revenue near $12.87bn (+12%), EPS around $0.82 and a 33.2% operating margin, while options imply an 8.4% one-day move. With the Nasdaq up 1.11% and the SOX up 1.61% after an eight-day slide, the result is the first real test of the AI-led rebound. Here are the numbers, the $65 / $70 / $75 levels and the three checks that matter.
Author  Irene Q.
19 hours ago
Netflix reports Q3 after the US close on October 20 with the stock at $69.85 (-0.96%), just below the $70 round number and far from its 52-week high of $124.86. Consensus looks for revenue near $12.87bn (+12%), EPS around $0.82 and a 33.2% operating margin, while options imply an 8.4% one-day move. With the Nasdaq up 1.11% and the SOX up 1.61% after an eight-day slide, the result is the first real test of the AI-led rebound. Here are the numbers, the $65 / $70 / $75 levels and the three checks that matter.
placeholder
Tesla Q3 Earnings Preview: Can Auto Margins Stabilize? Wall Street’s Highest Price Target at $550Tesla (TSLA) will report its third-quarter 2026 financial results after the U.S. stock market close on October 21, Eastern Time, and host an earnings conference call at 17:30 that day. Th
Author  TradingKey
15 hours ago
Tesla (TSLA) will report its third-quarter 2026 financial results after the U.S. stock market close on October 21, Eastern Time, and host an earnings conference call at 17:30 that day. Th
goTop
quote