

Ethereum Price To $12,000? ETH Could Repeat This Bitcoin 2020 Fractal

Source Newsbtc

With the bullish momentum growing in the cryptocurrency market, the large-cap altcoins have been some of the major beneficiaries of the current positive trend. Ethereum price, specifically, has continued to impress, with the second-largest cryptocurrency reasserting its position in the market over the past weeks.

The Ethereum price displayed significant bullish impetus going into the weekend, reclaiming the $4,000 mark for the first time since December 2024. Interestingly, the “king of altcoins” appears to only be at the beginning of an extended upward trajectory.

ETH Price To Soar By 182% In The Coming Months: Analyst

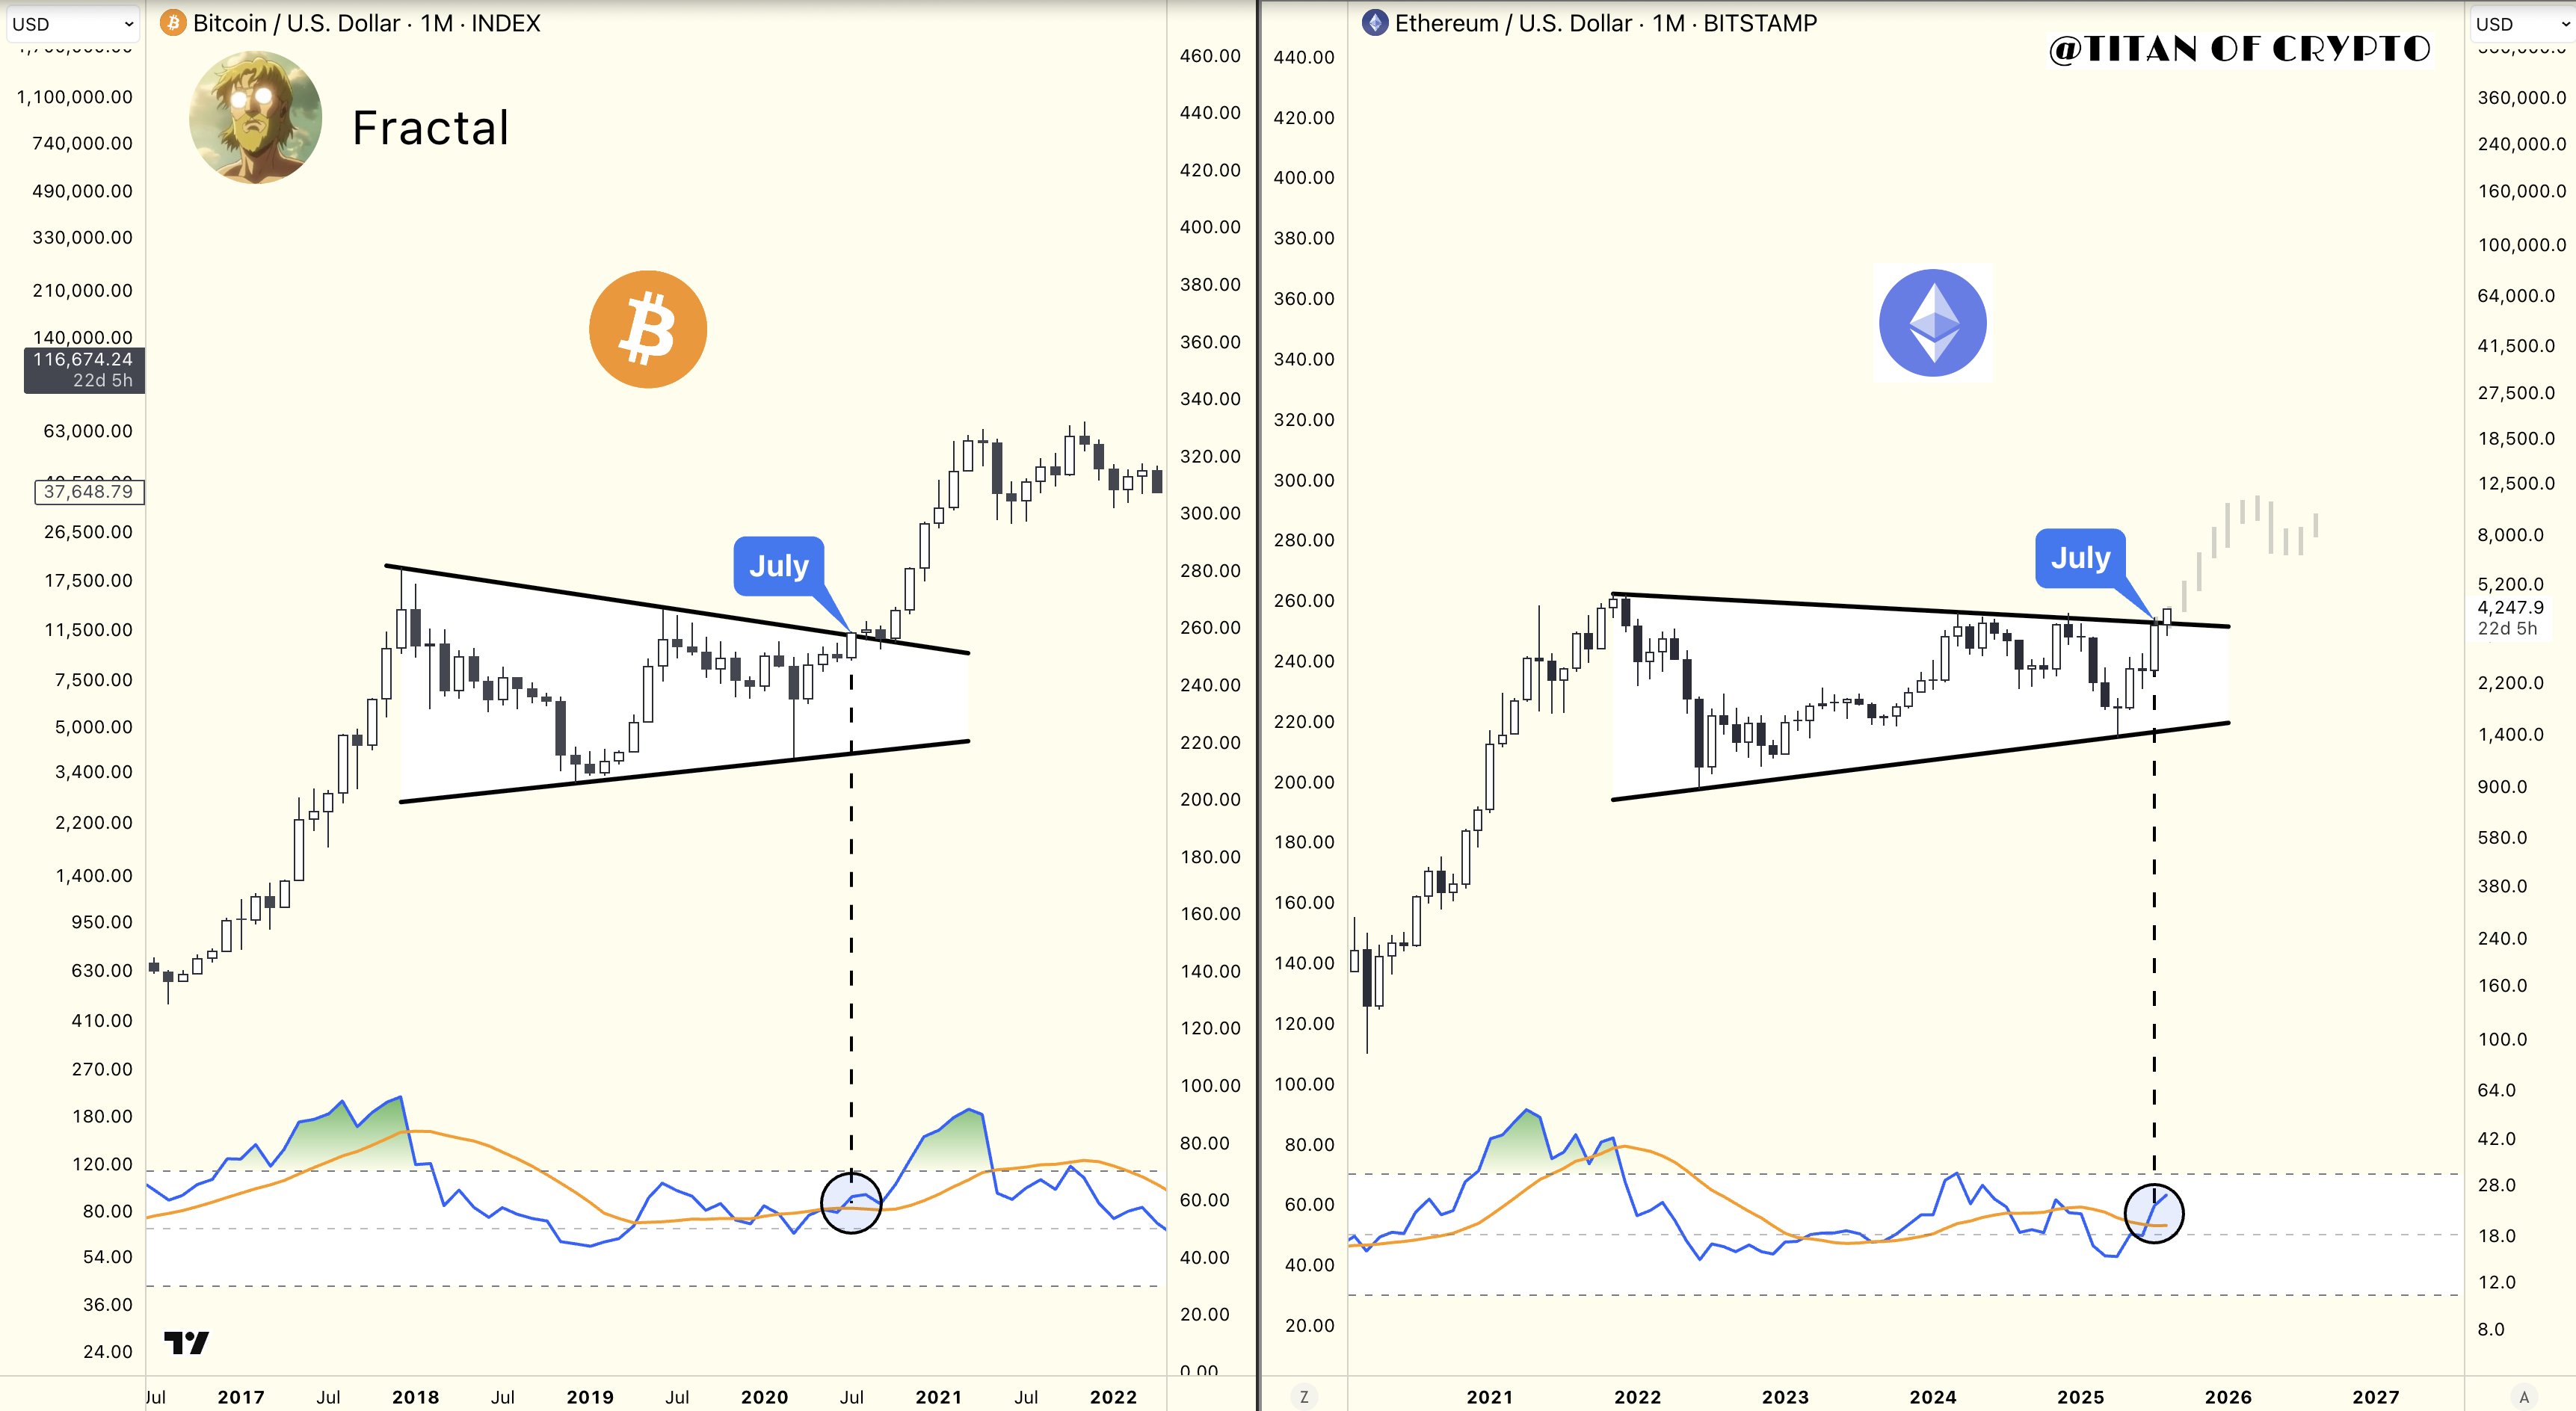
In an August 9 post on the social media platform X, pseudonymous crypto analyst Titan of Crypto shared an exciting layout for Ethereum that could see its price climb as high as $12,000. This positive projection is based on the price fractals of the world’s largest cryptocurrency by market capitalization, Bitcoin, in 2020.

In technical analysis, fractals refer to the recurring patterns on a price chart. These price patterns often offer insight into historical price movements and can be used to analyze the future trajectory of a cryptocurrency.

Titan of Crypto revealed that the Ethereum price is currently at the same spot that the price of BTC was in August 2020. At the time, the premier cryptocurrency was trading within a converging wedge pattern before breaking out to its then all-time-high price at around $69,000.
Ethereum Price

As shown in the chart above, the Ethereum price is currently trading within a similar converging wedge pattern on the monthly chart. Both BTC and ETH prices recently bounced off the lower boundary of the chart pattern earlier in 2020 and 2025, respectively.

Almost identically, the two largest cryptocurrencies almost broke above the trendline with their respective July 2020 and 2025 candlestick. While the price of BTC hovered around the upper trendline in the subsequent two months, the Ethereum price has broken clearly above the wedge pattern with its August candlestick.

If history is anything to go by, and a sustained monthly close above $4,000 occurs, the price of Ethereum could be on its way to an unprecedented high around the $12,000 region. This move represents a potential 182% surge for ETH from its current price point.

Ethereum Price At A Glance

As of this writing, the Ethereum token is valued at around $4,270, reflecting an almost 6% increase in the past 24 hours. According to data from CoinGecko, the altcoin is up by more than 25% in the past seven days.

Ethereum price
Disclaimer: For information purposes only. Past performance is not indicative of future results.
placeholder
Gold Price Analysis Today | Forex Gold Analysis | XAU/USD Analysis - November 11, 2026Get the latest gold price analysis, forex gold insights, and XAU/USD analysis for November 11, 2026. Read on for the details.
Author  Mitrade
Nov 11, Wed
Get the latest gold price analysis, forex gold insights, and XAU/USD analysis for November 11, 2026. Read on for the details.
placeholder
Bitcoin lost its 200-day average — but the exit started three sessions before the CPIBitcoin fell 2.5% to about $73,400 on 11 November, an 11-week low, breaking its 200-day moving average near $73,100. The 24-hour liquidation tally reached $632 to $705 million, roughly 82% of it longs. But spot ETF outflows began three sessions earlier and USDT's market cap has shrunk $6.6 billion in 60 days — the leveraged length left before the inflation print did. A double top at 81,890 and 81,080 leaves a measured target of 69,366.
Author  Suzie
Nov 11, Wed
Bitcoin fell 2.5% to about $73,400 on 11 November, an 11-week low, breaking its 200-day moving average near $73,100. The 24-hour liquidation tally reached $632 to $705 million, roughly 82% of it longs. But spot ETF outflows began three sessions earlier and USDT's market cap has shrunk $6.6 billion in 60 days — the leveraged length left before the inflation print did. A double top at 81,890 and 81,080 leaves a measured target of 69,366.
placeholder
Gold Extends Slide Below $4,000 as Rising US Inflation, Fed December Hike Bets Pressure Prices On November 12, gold prices (XAUUSD) extended their recent losses, falling further below $4,000 in early Asian trading to hit an intraday low near $3,968, marking a third consecutive day
Author  TradingKey
Yesterday 02: 00
On November 12, gold prices (XAUUSD) extended their recent losses, falling further below $4,000 in early Asian trading to hit an intraday low near $3,968, marking a third consecutive day
placeholder
Nvidia slid 7.7% after hours while AMD and Broadcom rose — the AI trade changed hands, it didn't breakNvidia closed Wednesday at 173.73, up 2.87%, then fell as much as 8.1% to 159.44 after reports that its board was preparing for a possible leadership change. The same session, the Philadelphia Semiconductor Index rose 5.7% with all 30 components higher, CoreWeave jumped 24.7% on 168% revenue growth, and Micron added 11.9%. If AI demand were being repriced, AMD and Broadcom would not be bid. This is a governance discount on one name, and 204.54 — the 200-day average — is the level that settles it.
Author  Irene Q.
Yesterday 02: 45
Nvidia closed Wednesday at 173.73, up 2.87%, then fell as much as 8.1% to 159.44 after reports that its board was preparing for a possible leadership change. The same session, the Philadelphia Semiconductor Index rose 5.7% with all 30 components higher, CoreWeave jumped 24.7% on 168% revenue growth, and Micron added 11.9%. If AI demand were being repriced, AMD and Broadcom would not be bid. This is a governance discount on one name, and 204.54 — the 200-day average — is the level that settles it.
placeholder
Gold closed below $4,000 again — the ETF crowd and central banks stayed, the momentum money leftSpot gold is trading near $3,999, its third consecutive lower daily low, after a 5.00% 10-year yield and a 102.85 dollar index raised the odds of a December hike to 87%. But the selling is not coming from the strategic holders: managed-money net longs fell to 324 tonnes, a 21-week low, and Goldman Sachs attributes roughly 95% of five weeks of selling to non-reportable positions. ETFs still hold a record 4,256 tonnes and central banks bought 321 tonnes in Q3. The table below sets the triggers, directions and levels.
Author  Irene Q.
Yesterday 03: 20
Spot gold is trading near $3,999, its third consecutive lower daily low, after a 5.00% 10-year yield and a 102.85 dollar index raised the odds of a December hike to 87%. But the selling is not coming from the strategic holders: managed-money net longs fell to 324 tonnes, a 21-week low, and Goldman Sachs attributes roughly 95% of five weeks of selling to non-reportable positions. ETFs still hold a record 4,256 tonnes and central banks bought 321 tonnes in Q3. The table below sets the triggers, directions and levels.
goTop
quote