

Ethena Price Forecast: ENA bullish case returns as open interest climbs back to $1 billion
- Ethena rises over 5% on Thursday, reflecting positive sentiment and the increase in speculative demand.
- Open Interest in future contracts reclaims the $1 billion mark following a brief decline to $916 million.
- Liquidations hammer short position holders the most as funding rates flip slightly positive.
Ethena (ENA) is extending intraday gains on Thursday, trading at around $0.63 at the time of writing, up more than 5% on the day. The token upholds a short-term bullish structure amid a renewed increase in Open Interest that could boost ENA toward the key resistance at $0.70.
Ethena rebounds as open interest steadies
Ethena’s derivatives market sheds light on the intraday breakout, suggesting that the short-term bullish case could remain steady in upcoming sessions. According to CoinGlass data, Open Interest (OI), which refers to the notional value of outstanding futures or options contracts, has rebounded above the $1 billion mark. This uptick follows a brief decline to $916 billion following last week’s sell-off.
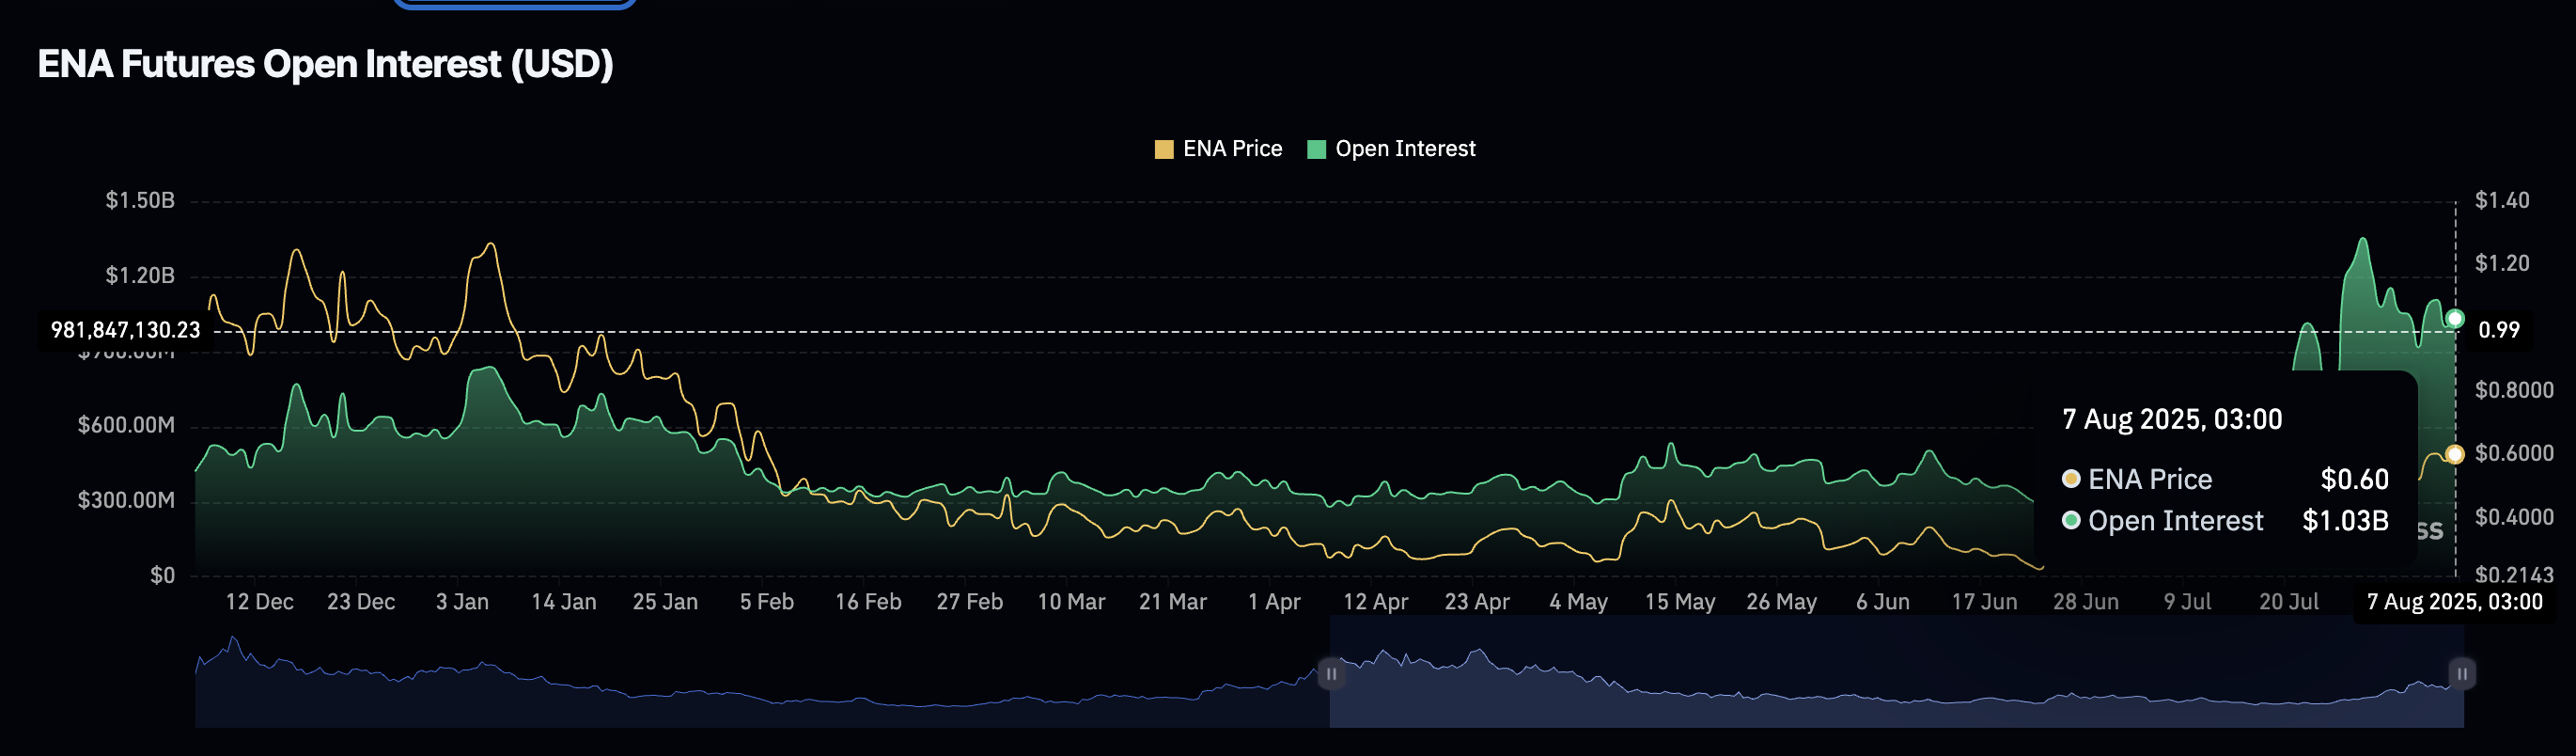
Ethena Futures Open Interest | Source: CoinGlass
A persistent increase in OI indicates that traders have a strong conviction in the uptrend and are willing to leverage long positions. The positive funding rate (chart below) affirms the bullish outlook. As sentiment improves, the probability of Ethena breaching the next hurdle at $0.70 and later extending the rally above the $1.00 level would significantly increase.
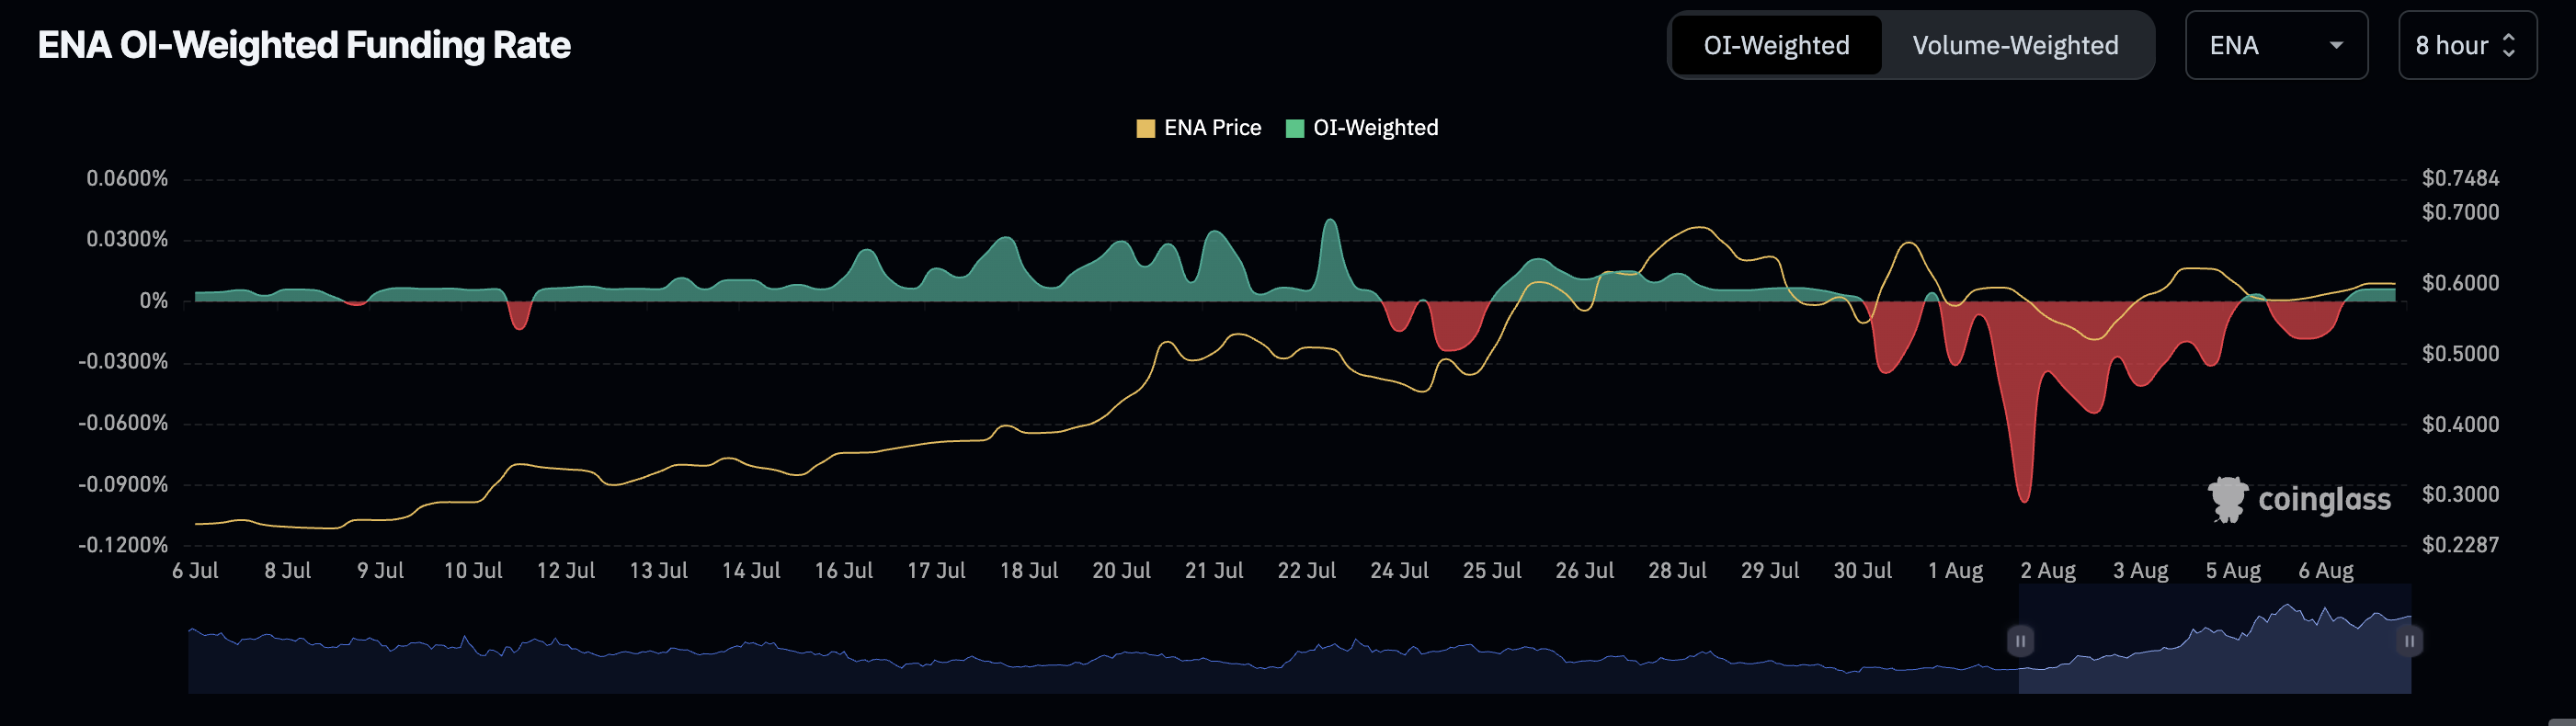
Ethena Futures Contracts Funding Rate | Source: CoinGlass
Meanwhile, liquidations in the derivatives market reached approximately $4.2 million in the last 24 hours. Short position holders accounted for the lion’s share of the liquidations, with around $3.63 million wiped out compared to roughly $623,000 in longs. The increase in short position liquidations underscores Ethena’s bullish case.
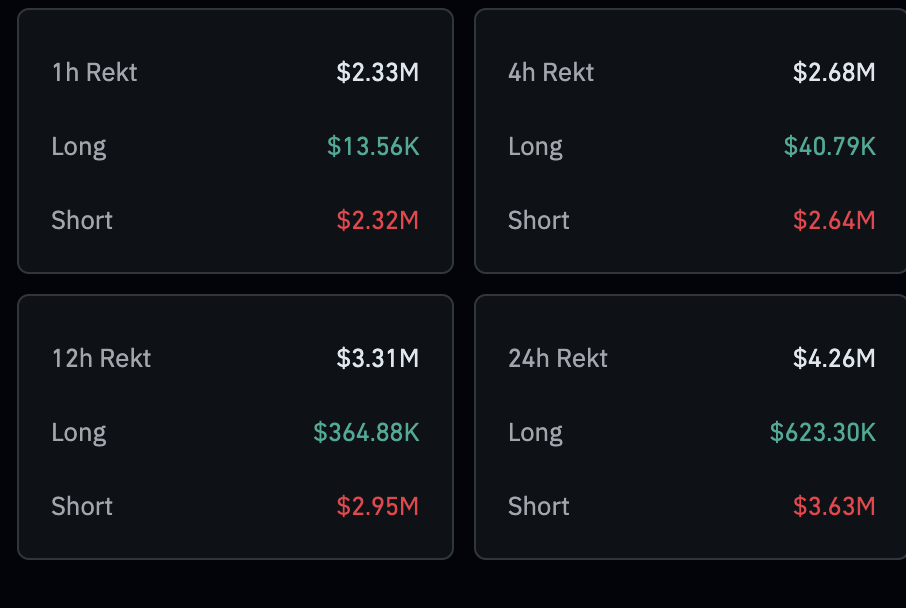
Ethena derivatives market liquidations | Source: CoinGlass
Technical outlook: Ethena bulls eye short-term breakout
Ethena price is trading above several key levels, including the 50-period Exponential Moving Average (EMA) at $0.58, the 100-period EMA at $0.55 and the 200-period EMA at $0.48, backing its short-term bullish technical structure.
The Moving Average Convergence Divergence (MACD) indicator affirms that bullish momentum is building as traders seek exposure following the validation of a buy signal triggered on Wednesday.
Speculative demand could remain steady as long as the blue MACD line holds above the red signal line. The Relative Strength Index (RSI), which is approaching overbought territory on the 4-hour chart, underpins the increase in buying pressure.
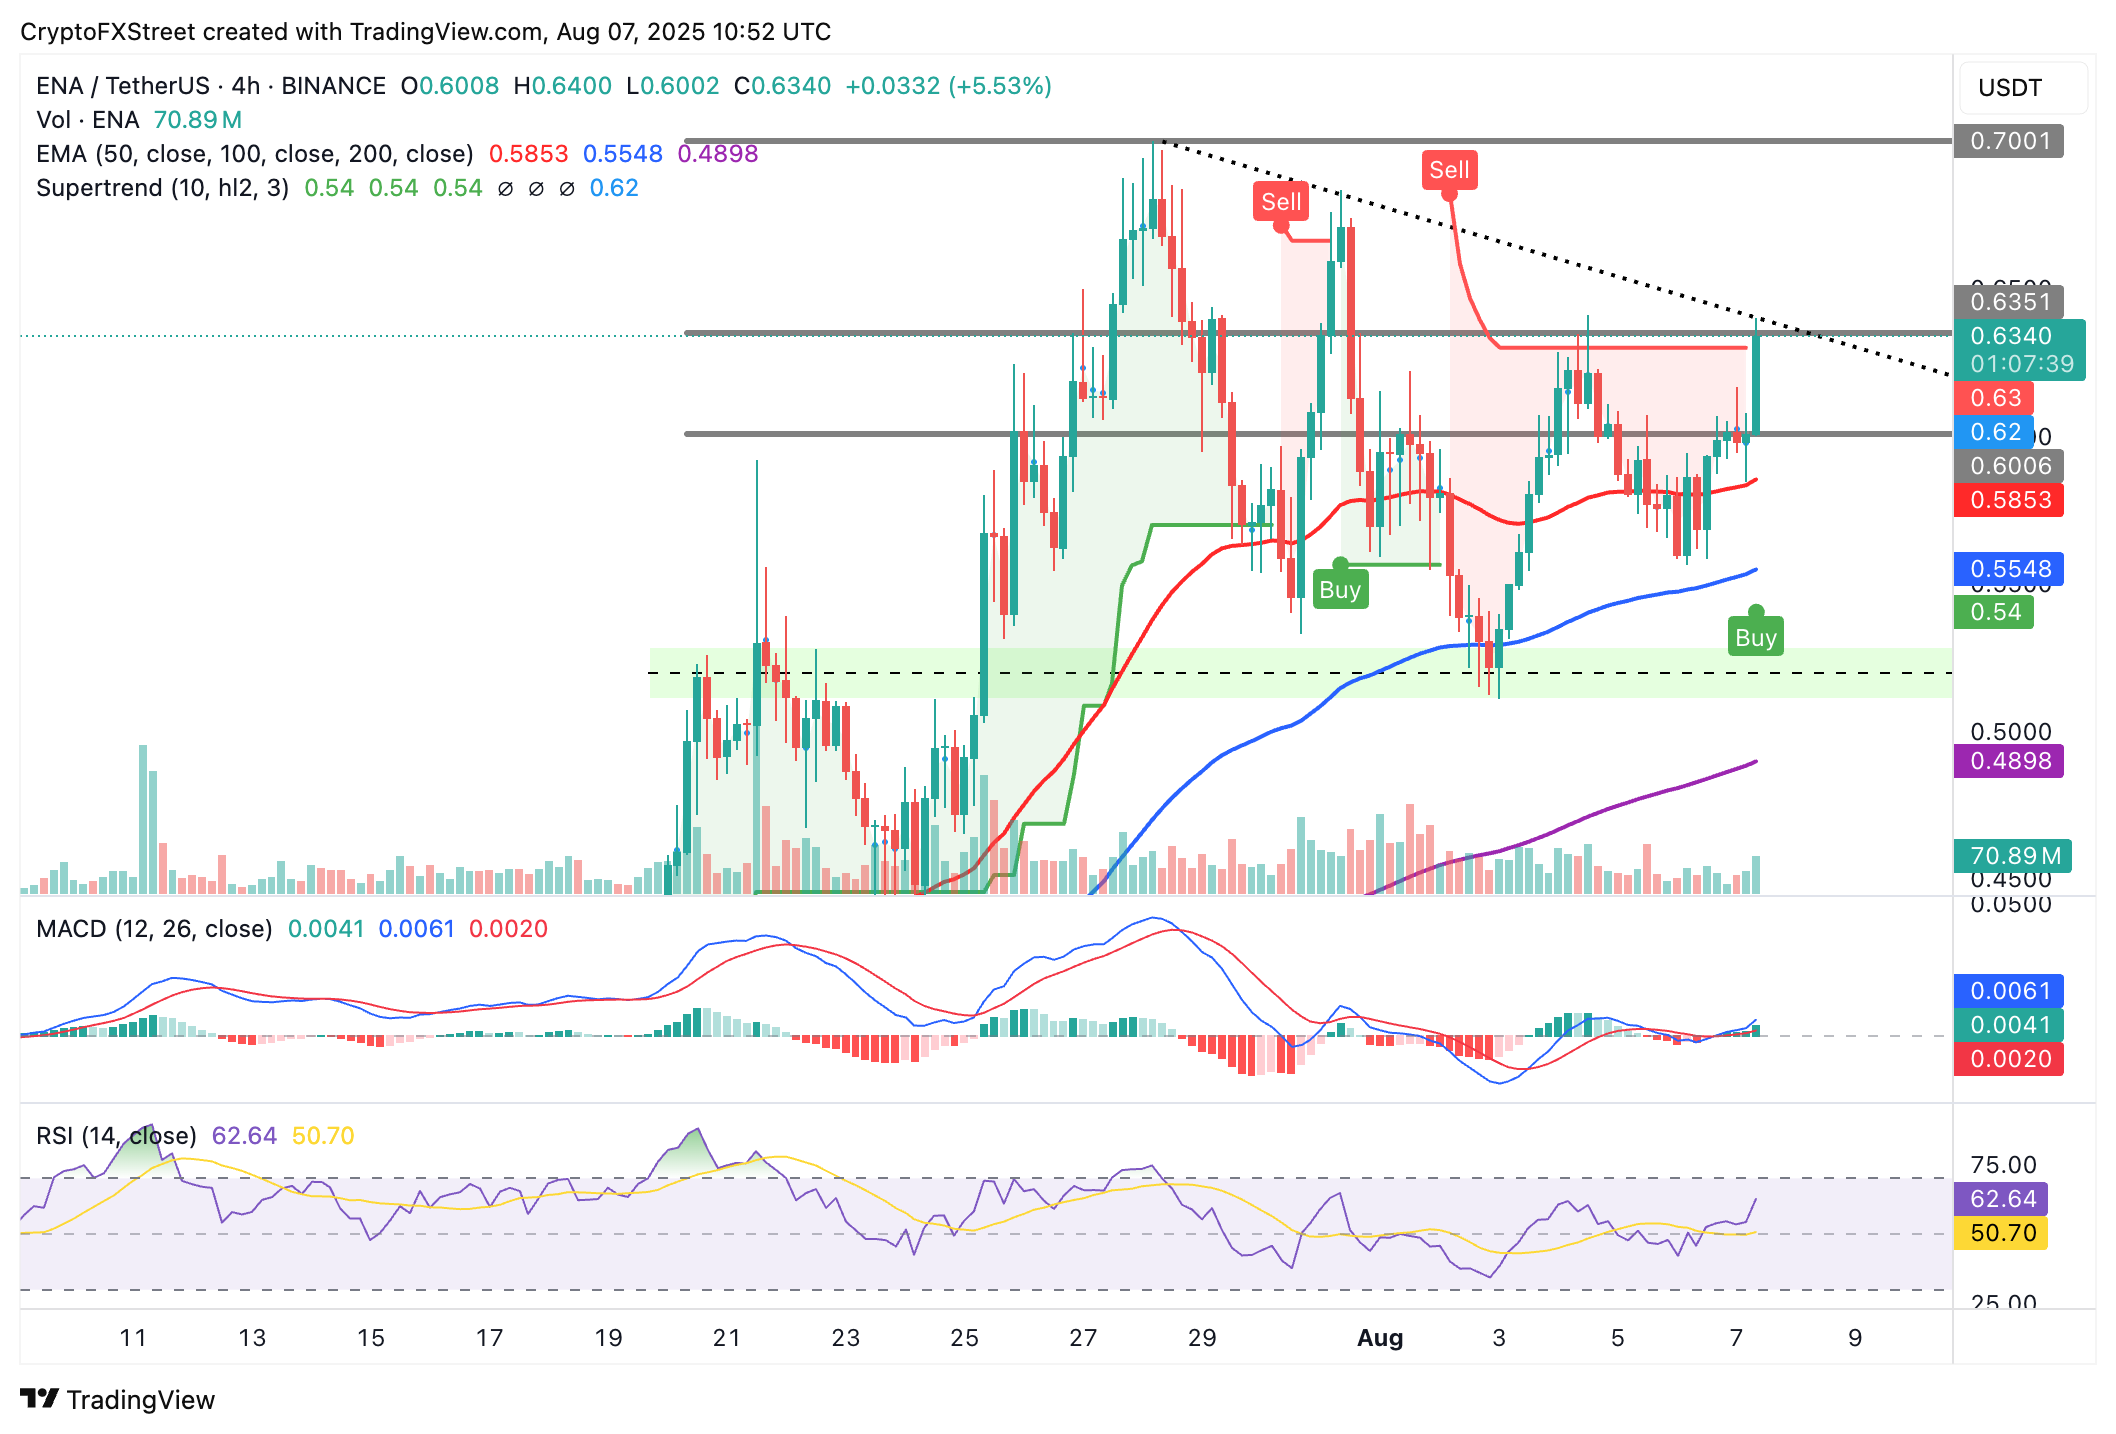
ENA/USDT 4-hour chart
Still, Ethena holds below the descending broken trendline, which could delay the uptrend, or encourage risk-off sentiment and profit taking. A daily close above the support at $0.60 would allow bulls to collect liquidity before pushing toward $0.70 resistance in the short term and the $1.00 critical level in the medium term.
Bitcoin, altcoins, stablecoins FAQs
Bitcoin is the largest cryptocurrency by market capitalization, a virtual currency designed to serve as money. This form of payment cannot be controlled by any one person, group, or entity, which eliminates the need for third-party participation during financial transactions.
Altcoins are any cryptocurrency apart from Bitcoin, but some also regard Ethereum as a non-altcoin because it is from these two cryptocurrencies that forking happens. If this is true, then Litecoin is the first altcoin, forked from the Bitcoin protocol and, therefore, an “improved” version of it.
Stablecoins are cryptocurrencies designed to have a stable price, with their value backed by a reserve of the asset it represents. To achieve this, the value of any one stablecoin is pegged to a commodity or financial instrument, such as the US Dollar (USD), with its supply regulated by an algorithm or demand. The main goal of stablecoins is to provide an on/off-ramp for investors willing to trade and invest in cryptocurrencies. Stablecoins also allow investors to store value since cryptocurrencies, in general, are subject to volatility.
Bitcoin dominance is the ratio of Bitcoin's market capitalization to the total market capitalization of all cryptocurrencies combined. It provides a clear picture of Bitcoin’s interest among investors. A high BTC dominance typically happens before and during a bull run, in which investors resort to investing in relatively stable and high market capitalization cryptocurrency like Bitcoin. A drop in BTC dominance usually means that investors are moving their capital and/or profits to altcoins in a quest for higher returns, which usually triggers an explosion of altcoin rallies.
Recommended Articles


