

Crude Oil extends rebound, WTI tests $78.20 after Chinese post-holiday demands picks up
- Crude Oil extended the week’s recovery.
- US API Weekly Crude Oil Stocks due later in the day.
- Energy markets are hoping for a boost in Chinese demand.
West Texas Intermediate (WTI) US Crude Oil climbed into a fresh high on Tuesday, extending the week’s technical recovery as energy markets lean into expectations of an uptick in Chinese Crude Oil after post-holiday travel caused increased purchases of Crude Oil.
Travel following the Chinese Lunar New Year was much higher than expected in the bottom half of February, causing Chinese Crude Oil inventories to decline faster than expected and pushing up the rate of purchases from Chinese refineries. China’s increase in spending and post-holiday Crude Oil consumption has sparked hopes across barrel markets that Chinese barrel demand will remain high enough to sop up extra capacity.
Maintenance halts are also expected this year in mainland China, where reduced refining capacity is expected to reach a three-year high, further constraining supply of refined oil products within China.
Chinese demand picks up, US API Crude Stocks expected
The American Petroleum Institute (API) is releasing its latest week-on-week US Crude Oil Stocks figures, which lasted printed a 7.8 million barrel increase in excess barrels floating around the US Crude Oil supply chains.
Energy markets are also shrugging off renewed expectations of a potential ceasefire in the ongoing Gaza conflict between Israel and Palestinian Hamas. Barrel traders remain concerned that the altercation could spill over into nearby Crude Oil-focused economies, risking supply chain disruptions in the Middle East.
WTI technical outlook
WTI once again climbed back into the $78.00 handle, testing $78.20 per barrel on Tuesday. US Crude Oil extended a rebound from Friday’s bottom near $75.80, and WTI continues to churn within rough consolidation between $78.40 and $76.00.
WTI remains mired in the 200-day Simple Moving Average (SMA) near $77.65, and near-term bullish momentum remains capped below January’s late peak at $79.20.
WTI hourly chart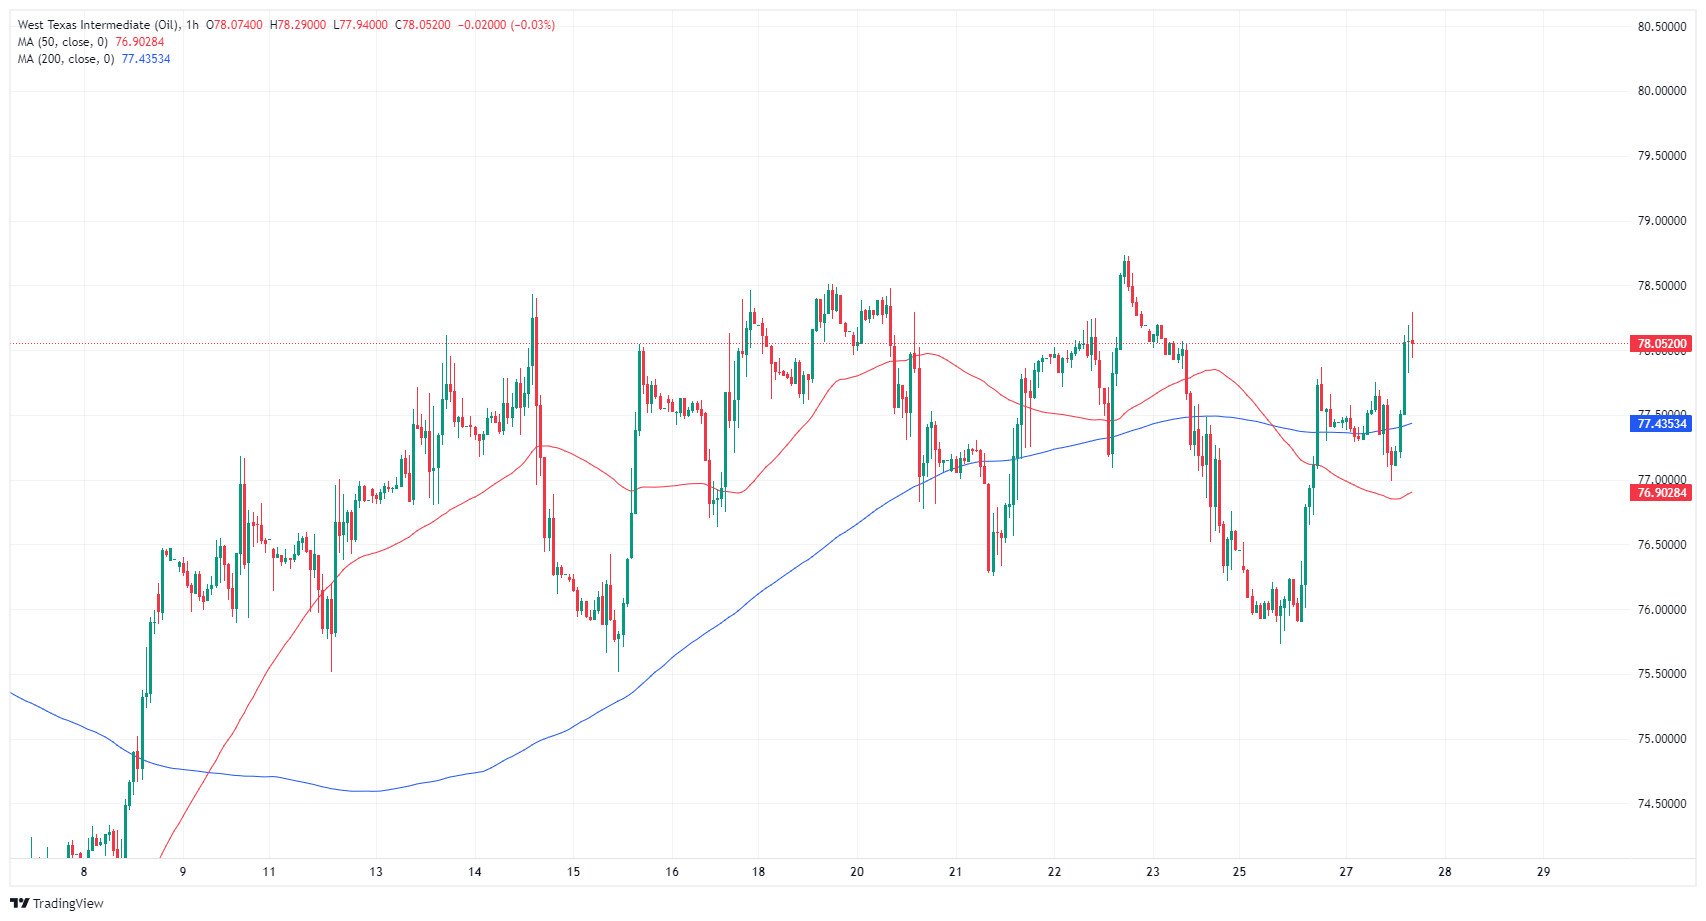
WTI daily chart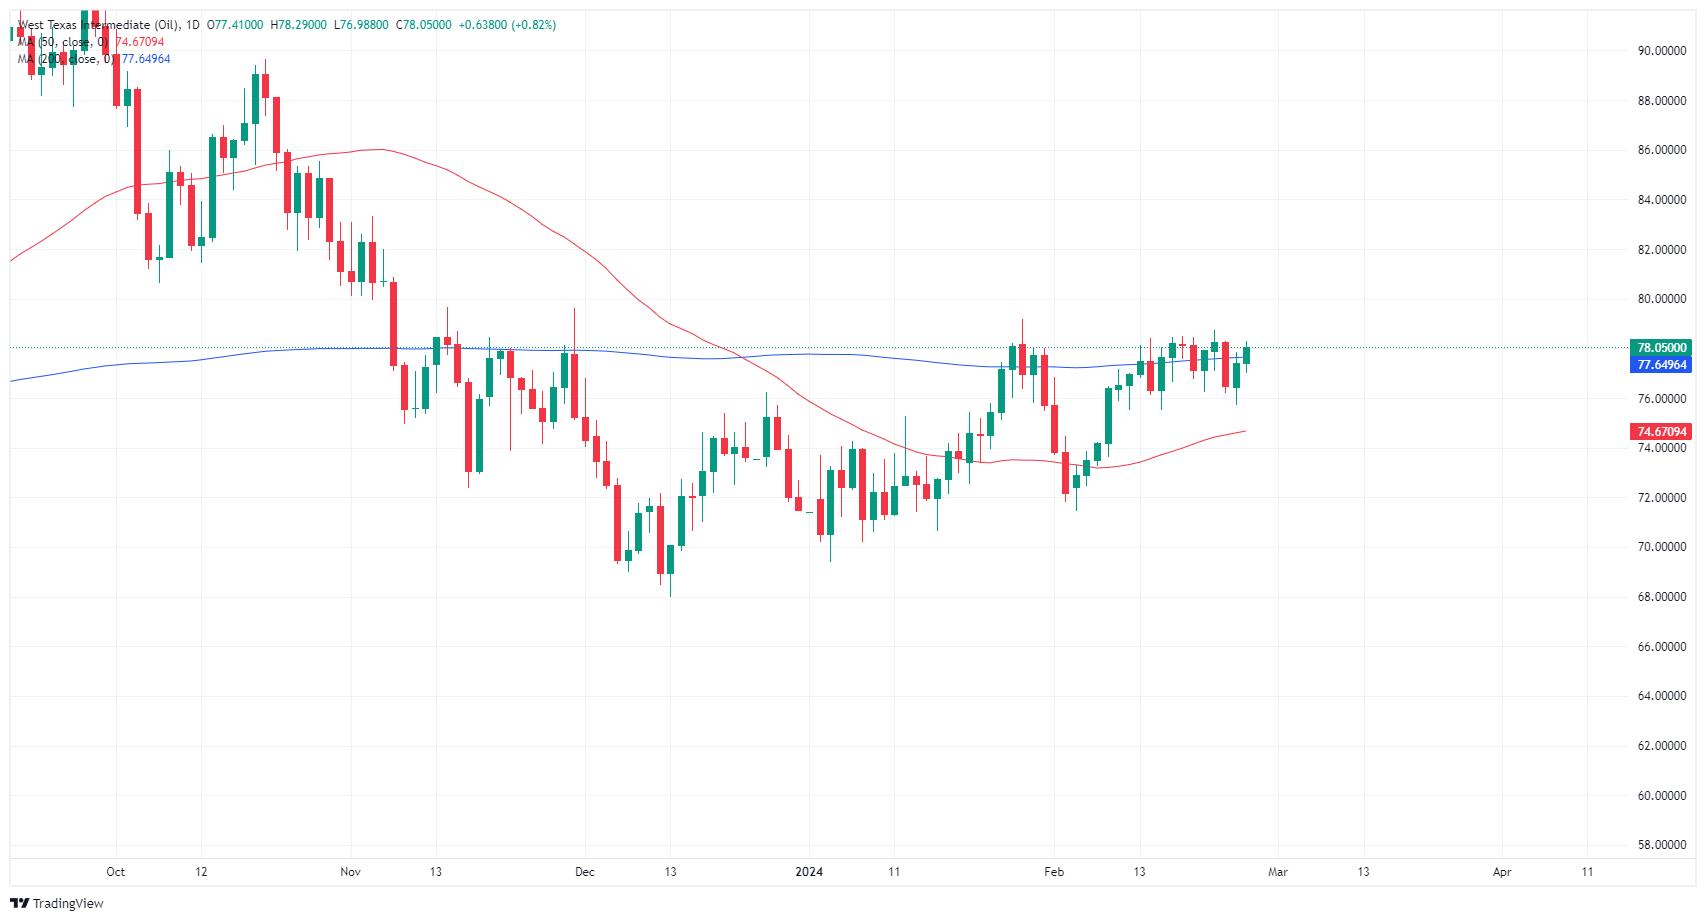
Recommended Articles


