

Crude Oil extends rebound amid concerns about impact of Francine tropical storm on US production
- Crude Oil pops above a crucial pivotal level as it recovers for a second day in a row.
- Tropical storm Francine hits Louisiana, with several on- and offshore installations in the region evacuated.
- The US Dollar Index trades above 101.50 and tests its upper boundary of its bandwidth for a break higher.
Crude Oil pops over 1.50% for a second day in a row after booking over 1.50% gains on Wednesday, which was the biggest daily gain for Crude Oil in two weeks. The uptick comes amid increasing concerns over the impact of tropical storm Francine on US production and after the most recent OPEC report – which cut the outlook for Oil demand – was deemed unrealistic considering recent US and global economic activity.
The US Dollar Index (DXY), which tracks the performance of the US Dollar (USD) against a basket of currencies, is stronger and tests the upper band of its tight bandwidth in which it has been trading for over two weeks. The stronger Greenback emerged after US Consumer Price Index data revealed a surprise uptick in the monthly core measure. That closed the door for a 50-basis-point rate cut from the US Federal Reserve next week, supporting the US Dollar.
At the time of writing, Crude Oil (WTI) trades at $67.93 and Brent Crude at $71.57
Oil news and market movers: Statistics add up
- The International Energy Agency (IEA) released its monthly report, which showed that the recent outage from Libya triggered a 70,000 barrels per day decline in OPEC’s daily output. Supply from Libya declined by 180,000 barrels per day to 980,000, Bloomberg reported.
- The IEA also reported that supply from the Gulf producers was largely steady, with Saudi output unchanged at 9.01 million barrels per day, Iraq at 4.38 million b/d, UAE at 3.3 million b/d and Kuwait at 2.52 million b/d, Reuters reports.
- In the US, tropical storm Francine has hit the coast of Louisiana, reaching a Category 2 strength. Oil and gas companies had previously evacuated offshore platforms in the Gulf of Mexico, Reuters reported.
Oil Technical Analysis: Damned if you do, and damned if you don’t
Crude Oil price is set for volatility, and it has no one other than OPEC to thank for it. Still, the chances for more downside look higher than the potential for rebound. Should OPEC tweak its policy and prolong production cuts, or broaden them, markets could interpret it as a sign of weakness and perceive it as the situation is far more dire than anticipated. In case it does nothing, markets will likely remain focused on oversupply.
Oil has a long road to recovery ahead before heading back above $75. First up is $67.11, which needs to see a daily close above at least. Once that level gets reclaimed, $70.00 gets back on the table with $71.46 as the first level to look out for. Ultimately, a return to $75.27 is still possible, but would likely come due to a seismic shift in current balances.
The next level further down the line is $64.38, the low from March and May 2023. Should that level face a second test and snap, $61.65 becomes a target, with of course $60.00 as a psychologically big figure just below it, at least tempting to be tested.
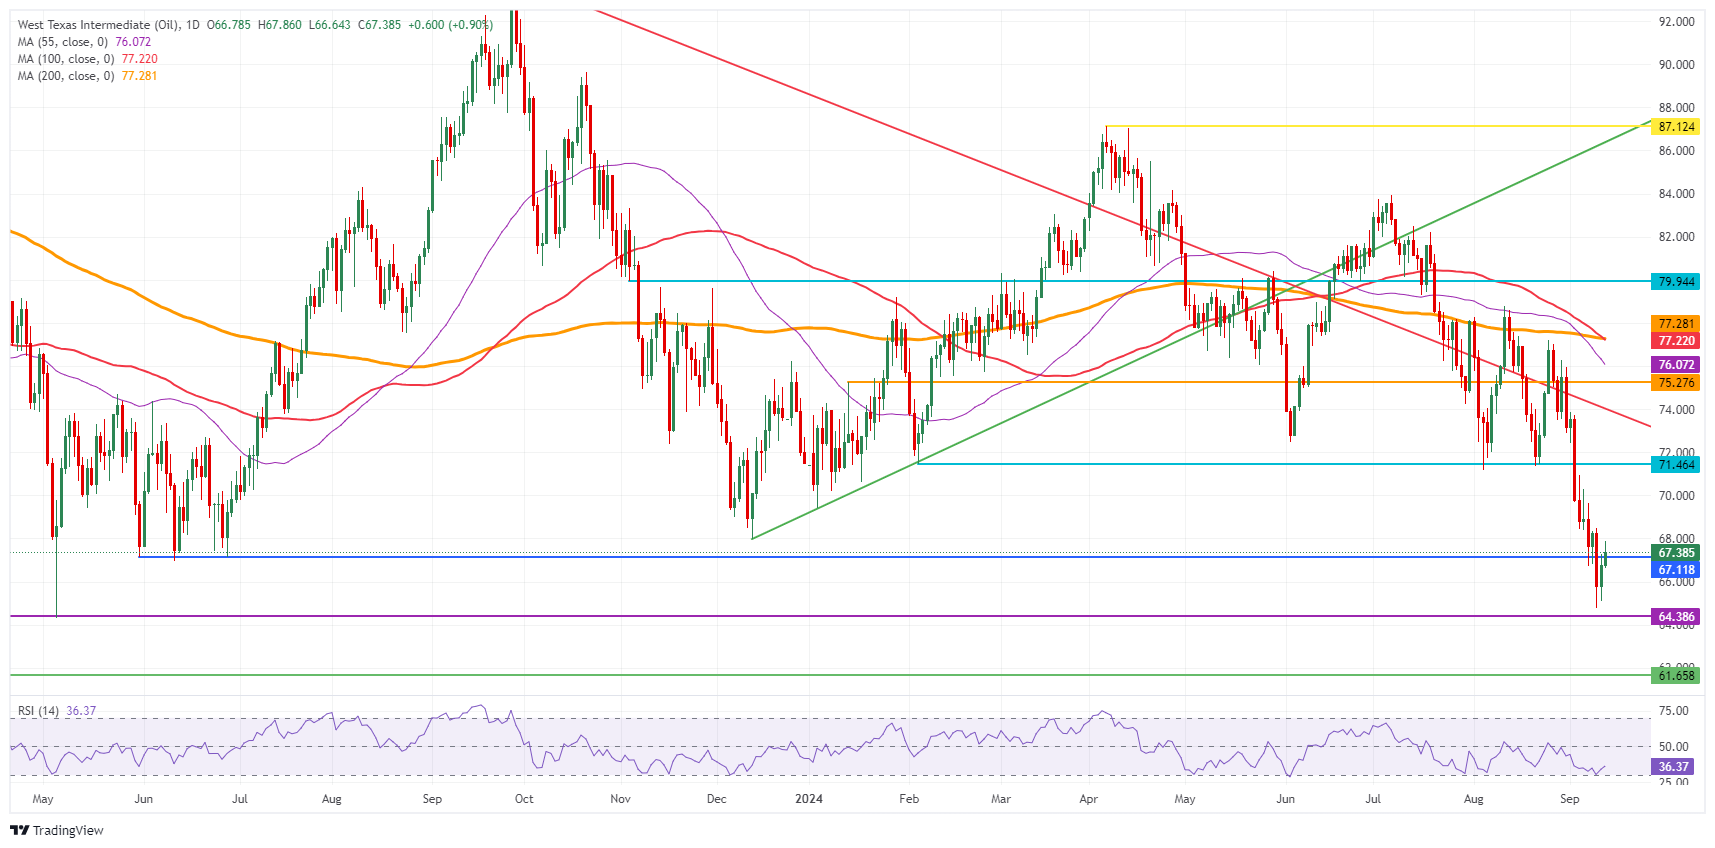
US WTI Crude Oil: Daily Chart
WTI Oil FAQs
WTI Oil is a type of Crude Oil sold on international markets. The WTI stands for West Texas Intermediate, one of three major types including Brent and Dubai Crude. WTI is also referred to as “light” and “sweet” because of its relatively low gravity and sulfur content respectively. It is considered a high quality Oil that is easily refined. It is sourced in the United States and distributed via the Cushing hub, which is considered “The Pipeline Crossroads of the World”. It is a benchmark for the Oil market and WTI price is frequently quoted in the media.
Like all assets, supply and demand are the key drivers of WTI Oil price. As such, global growth can be a driver of increased demand and vice versa for weak global growth. Political instability, wars, and sanctions can disrupt supply and impact prices. The decisions of OPEC, a group of major Oil-producing countries, is another key driver of price. The value of the US Dollar influences the price of WTI Crude Oil, since Oil is predominantly traded in US Dollars, thus a weaker US Dollar can make Oil more affordable and vice versa.
The weekly Oil inventory reports published by the American Petroleum Institute (API) and the Energy Information Agency (EIA) impact the price of WTI Oil. Changes in inventories reflect fluctuating supply and demand. If the data shows a drop in inventories it can indicate increased demand, pushing up Oil price. Higher inventories can reflect increased supply, pushing down prices. API’s report is published every Tuesday and EIA’s the day after. Their results are usually similar, falling within 1% of each other 75% of the time. The EIA data is considered more reliable, since it is a government agency.
OPEC (Organization of the Petroleum Exporting Countries) is a group of 13 Oil-producing nations who collectively decide production quotas for member countries at twice-yearly meetings. Their decisions often impact WTI Oil prices. When OPEC decides to lower quotas, it can tighten supply, pushing up Oil prices. When OPEC increases production, it has the opposite effect. OPEC+ refers to an expanded group that includes ten extra non-OPEC members, the most notable of which is Russia.
Recommended Articles


