


Gold price surges as Fed rate cut bets lift prices to two-week peak
- Gold advances sharply, gaining over 1% amid weakening US economic indicators.
- Softer US jobs and housing data increase expectations of two 25-bps Fed rate cuts in 2024.
- Rising geopolitical tensions in the Middle East and North Korea-Russia pact enhance Gold's safe-haven appeal.
Gold prices advanced sharply by more than 1% on Thursday during the North American session as US Treasury bond yields advanced to underpin the Greenback. Data from the United States was softer than expected, boosting traders' confidence that the Federal Reserve (Fed) will ease policy at least twice in 2024. The XAU/USD trades at $2,356 at the time of writing.
The latest economic data from the US continued to show that the economy is decelerating, prompting investors to price in two 25-basis-point (bps) interest rate cuts. A worse-than-expected US jobs report revealed the number of Americans filing for unemployment benefits rose above estimates.
US housing data disappoints markets as Building Permits and Housing Starts cooled.
In the meantime, Minneapolis Fed President Neel Kashkari stated that it will likely take a year or two to bring core inflation down to 2%. He added that the trajectory of interest rates would depend on the economic conditions, emphasizing, "We are achieving disinflation despite remarkable economic growth."
Rising geopolitical risks helped the golden metal uptrend. Tensions in the Middle East are rising as Israel threatens to launch an attack on Hezbollah in Lebanon. That, along with the recently signed pact between Russia and North Korea, could increase the appeal for the yellow metal, which is trading near a crucial resistance level.
The CME FedWatch Tool shows that the odds for a 25 bps rate cut for September stand at 58%, down from 62% a day ago. In the meantime, the December 2024 fed funds futures contract implies the Fed will cut 36 bps toward the end of the year.
Daily digest market movers: Gold price rises amid high US yields and strong USD
- US Dollar Index prints gains of 0.405, up at 105.64, a headwind for Gold prices.
- US Treasury bond yields jumped, 10-year Treasury note yield is up more than four basis points to 4.257%.
- US Initial Jobless Claims for the week ending June 15 rose to 238K, exceeding estimates of 235K but lower than the previous reading of 243K.
- US Building Permits declined by 3.6% in May, dropping from 1.44 million to 1.386 million. Housing Starts for the same period fell by 5.5%, from 1.352 million to 1.277 million.
- Fed officials counseled patience on interest rate cuts and emphasized they would remain data dependent. Although last week's CPI report was positive, policymakers reiterated they need to see more reports like May’s data.
- Despite the US CPI report showing that the disinflation process continues, Fed Chair Jerome Powell commented that they remain “less confident” about the progress on inflation.
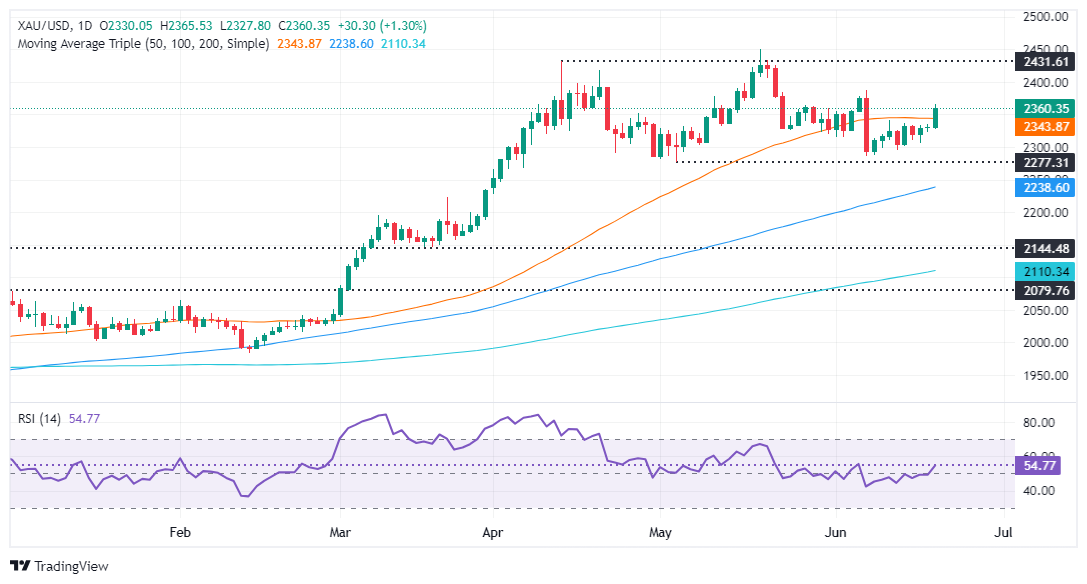
Technical analysis: Gold price challenges Head-and-Shoulders pattern, climbs past $2,350
Gold buyers are testing the Head-and-Shoulders pattern, dragging the golden metal above the pattern’s neckline. A daily close above the latter's confluence and the 50-day Simple Moving Averages (SMA) at around $2,343 could negate the bearish chart pattern and open the door for further gains.
In that event, Gold could extend its gains above $2,350, exposing additional key resistance levels. Next would be the June 7 cycle high of $2,387, ahead of challenging the $2,400 figure.
Conversely, if XAU/USD drops below $2,343, that would keep the Head-and-Shoulders chart pattern intact, and Gold could be headed to the downside. If XAU/USD slides drops below $2,300, the next support would be the May 3 low of $2,277, followed by the March 21 high of $2,222. Further losses lie underneath, with sellers eyeing the Head-and-Shoulders chart pattern objective from $2,170 to $2,160.
Gold FAQs
Gold has played a key role in human’s history as it has been widely used as a store of value and medium of exchange. Currently, apart from its shine and usage for jewelry, the precious metal is widely seen as a safe-haven asset, meaning that it is considered a good investment during turbulent times. Gold is also widely seen as a hedge against inflation and against depreciating currencies as it doesn’t rely on any specific issuer or government.
Central banks are the biggest Gold holders. In their aim to support their currencies in turbulent times, central banks tend to diversify their reserves and buy Gold to improve the perceived strength of the economy and the currency. High Gold reserves can be a source of trust for a country’s solvency. Central banks added 1,136 tonnes of Gold worth around $70 billion to their reserves in 2022, according to data from the World Gold Council. This is the highest yearly purchase since records began. Central banks from emerging economies such as China, India and Turkey are quickly increasing their Gold reserves.
Gold has an inverse correlation with the US Dollar and US Treasuries, which are both major reserve and safe-haven assets. When the Dollar depreciates, Gold tends to rise, enabling investors and central banks to diversify their assets in turbulent times. Gold is also inversely correlated with risk assets. A rally in the stock market tends to weaken Gold price, while sell-offs in riskier markets tend to favor the precious metal.
The price can move due to a wide range of factors. Geopolitical instability or fears of a deep recession can quickly make Gold price escalate due to its safe-haven status. As a yield-less asset, Gold tends to rise with lower interest rates, while higher cost of money usually weighs down on the yellow metal. Still, most moves depend on how the US Dollar (USD) behaves as the asset is priced in dollars (XAU/USD). A strong Dollar tends to keep the price of Gold controlled, whereas a weaker Dollar is likely to push Gold prices up.
Recommended Articles


