

Crude Oil stumbles amidst energy market jitters, WTI falls into a second month of losses
- WTI fell into the red for the week, etching in a second month of declines.
- US Crude Oil production remains a concern despite downturn in supplies.
- OPEC broadly expected to maintain voluntary production cuts.
West Texas Intermediate (WTI) US Crude Oil backslid in fresh lows for the week, going into the red from Monday and testing below $77.00 per barrel. WTI is set to end a second straight down month as energy traders remain concerned that global demand will be unable to avoid getting swamped out by US Crude Oil production.
According to the American Petroleum Institute (API) and the Energy Information Administration (EIA), US Crude Oil supplies contracted sharply week-over-week, however rising inventories in refineries pushed barrel bids lower this week. A disappointing run-up to the Memorial Day driving season has left refined petroleum product producers holding more supply than they intended, combined with a warmer-than-expected winter that saw declines in demand for heating oil.
OPEC plans to extend current output caps, but no new restrictions on the table
The Organization of the Petroleum Exporting Countries (OPEC) and its extended network of non-member ally states, OPEC , are due to meet on Sunday to discuss the oil cartel’s voluntary output restrictions put in place in 2023 to support global Crude Oil prices. OPEC is broadly expected to maintain current pumping quotas, with unnamed sources reporting that the conglomerate is likely to extend production caps through 2025. However, energy traders are increasingly skeptical that current production limits will be enough as US Crude Oil production continues to climb.
US President Joe Biden announced on Friday that a possible ceasefire deal is close to being reached between Israel and Palestinian Hamas, which could see the two sides of the conflict agreeing to a multi-month ceasefire. The possibility of easing tensions in the Middle East is further crimping barrel demand after Crude Oil markets spent months driving up barrel bids on concerns the Israel-Hamas conflict could spill over into neighboring nations critical to global Crude Oil production.
US Personal Consumption Expenditures (PCE) Price Index inflation eased unexpectedly MoM in April, falling to 0.2% MoM versus the forecast hold at 0.3%. Increased market bets of a September rate cut from the Federal Reserve (Fed) were unable to spark a meaningful spike in Crude Oil markets as a sharp decline in US Personal Spending growth bodes poorly for WTI demand. Personal Spending grew by a slim 0.2% in April, less than the forecast 0.3% and even further down from the previous print of 0.7%.
WTI technical outlook
WTI fell to a fresh weekly low of 76.50 on Friday, sending barrels into the red for the week and securing a second month of declines in US Crude Oil. WTI rose to an intraday high near $78.40 on Friday, but tumbled after knocking on the 200-hour Exponential Moving Average (EMA) which is descending into $78.30.
WTI continues to consolidate near familiar technical levels as US Crude Oil remains unable to decisively crack through the 200-day EMA at $79.00. WTI remains up nearly 8% in 2024, but still remains down nearly 12% from the year’s peaks set in April just above $87.00.
WTI hourly chart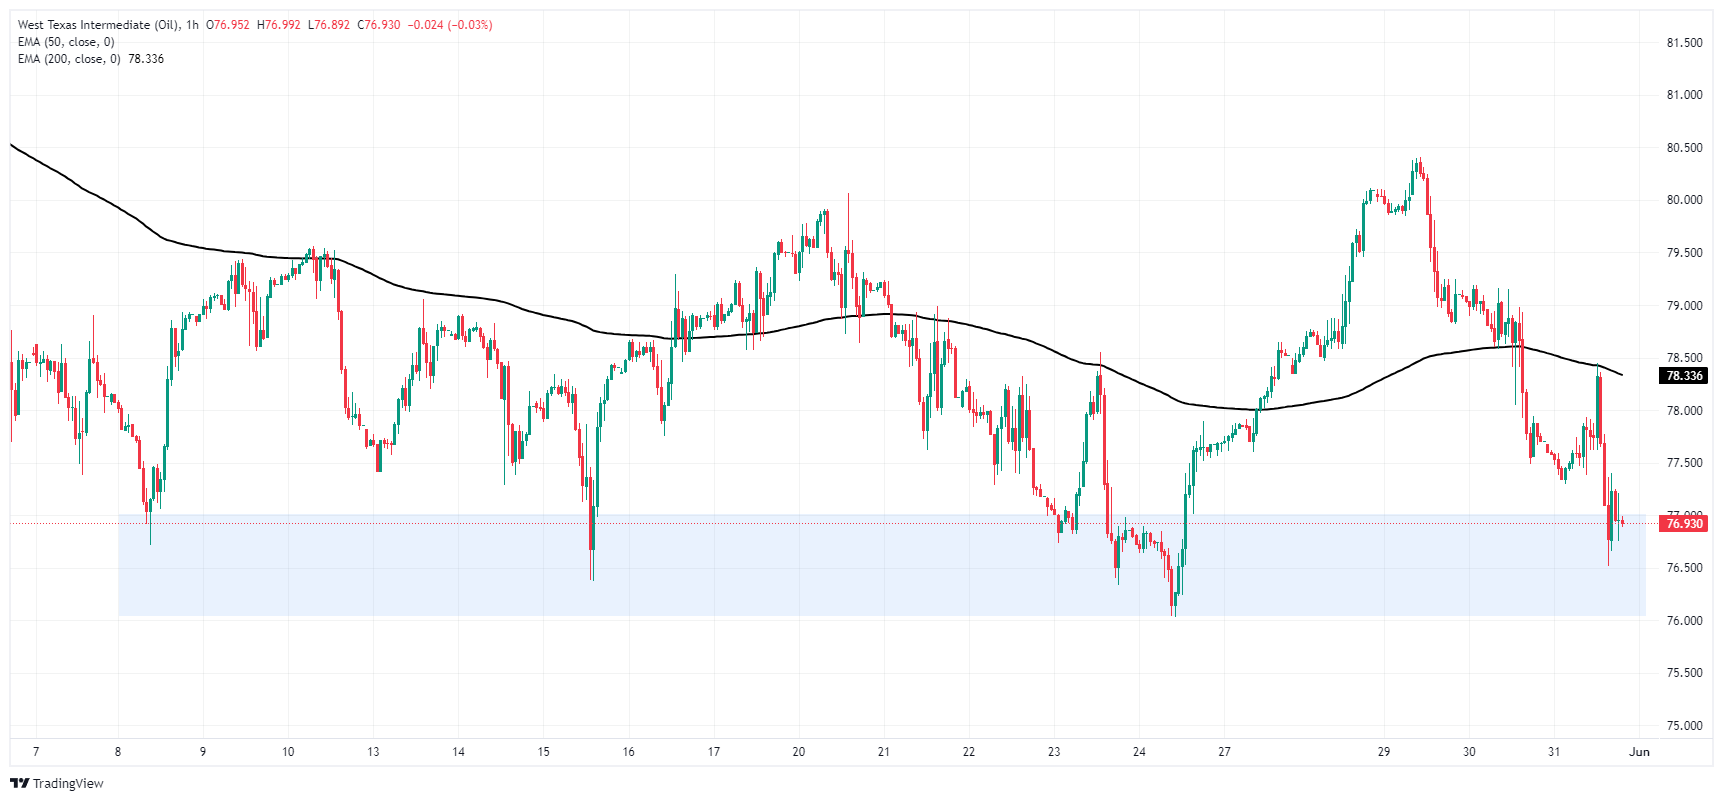
WTI daily chart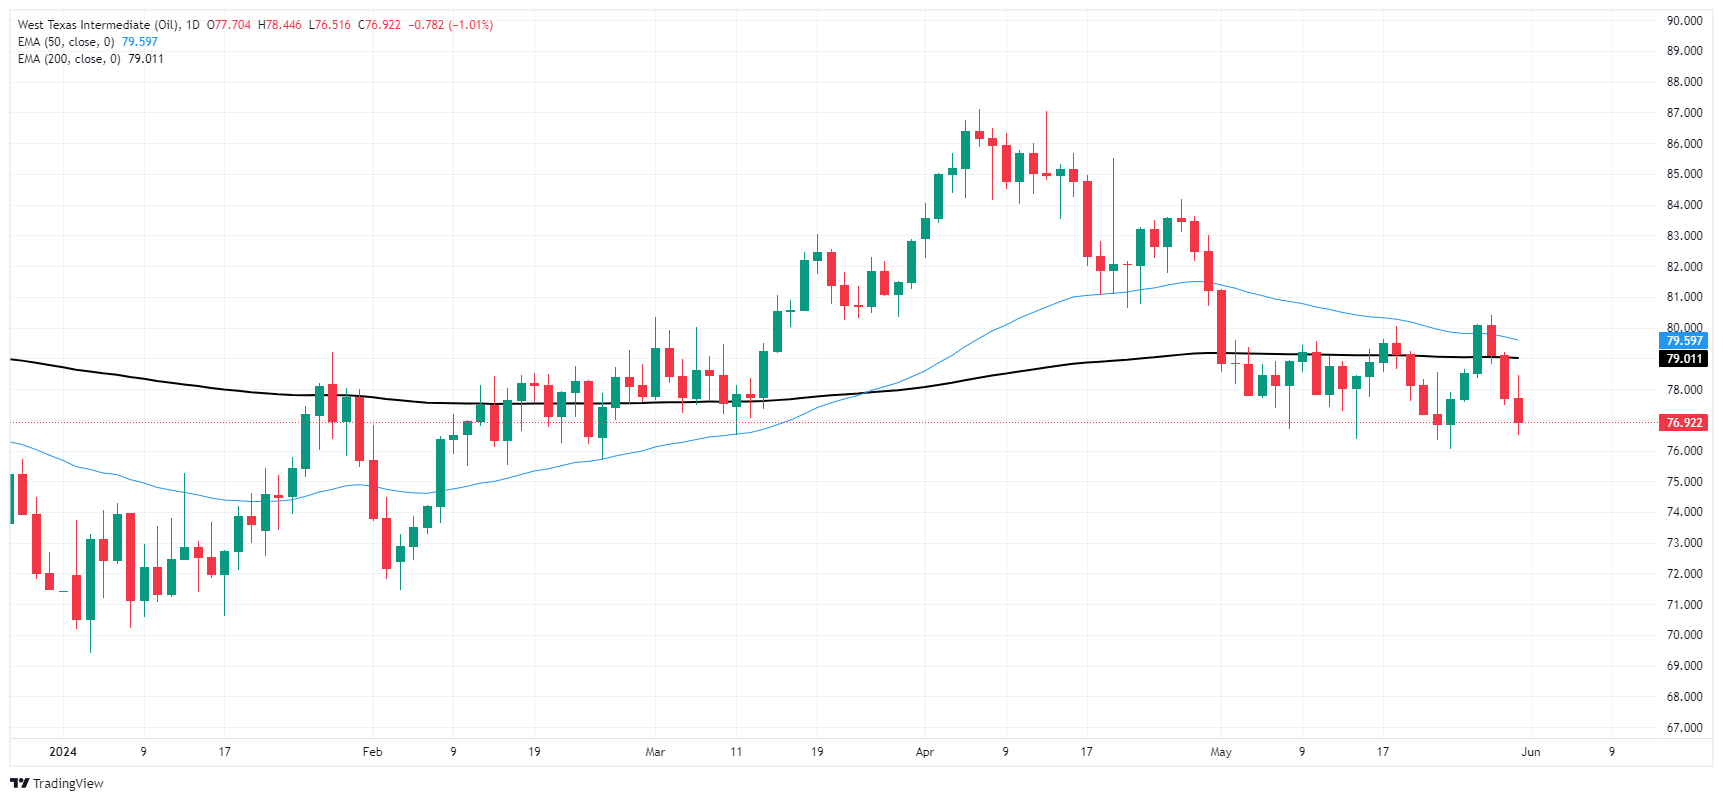
Recommended Articles


