


Crude Oil watches the region catch fire and still cannot clear its ceiling
- WTI fades to just below $79.00 after another rejection at the $80.00 handle, down about one percent on the session.
- US strikes hit a tanker near Iran's main export terminal overnight while the naval blockade returns and Strait of Hormuz traffic thins.
- The Houthis declare Saudi energy facilities and the Bab al-Mandab Strait fair targets, aiming directly at the market's spare-capacity insurance.
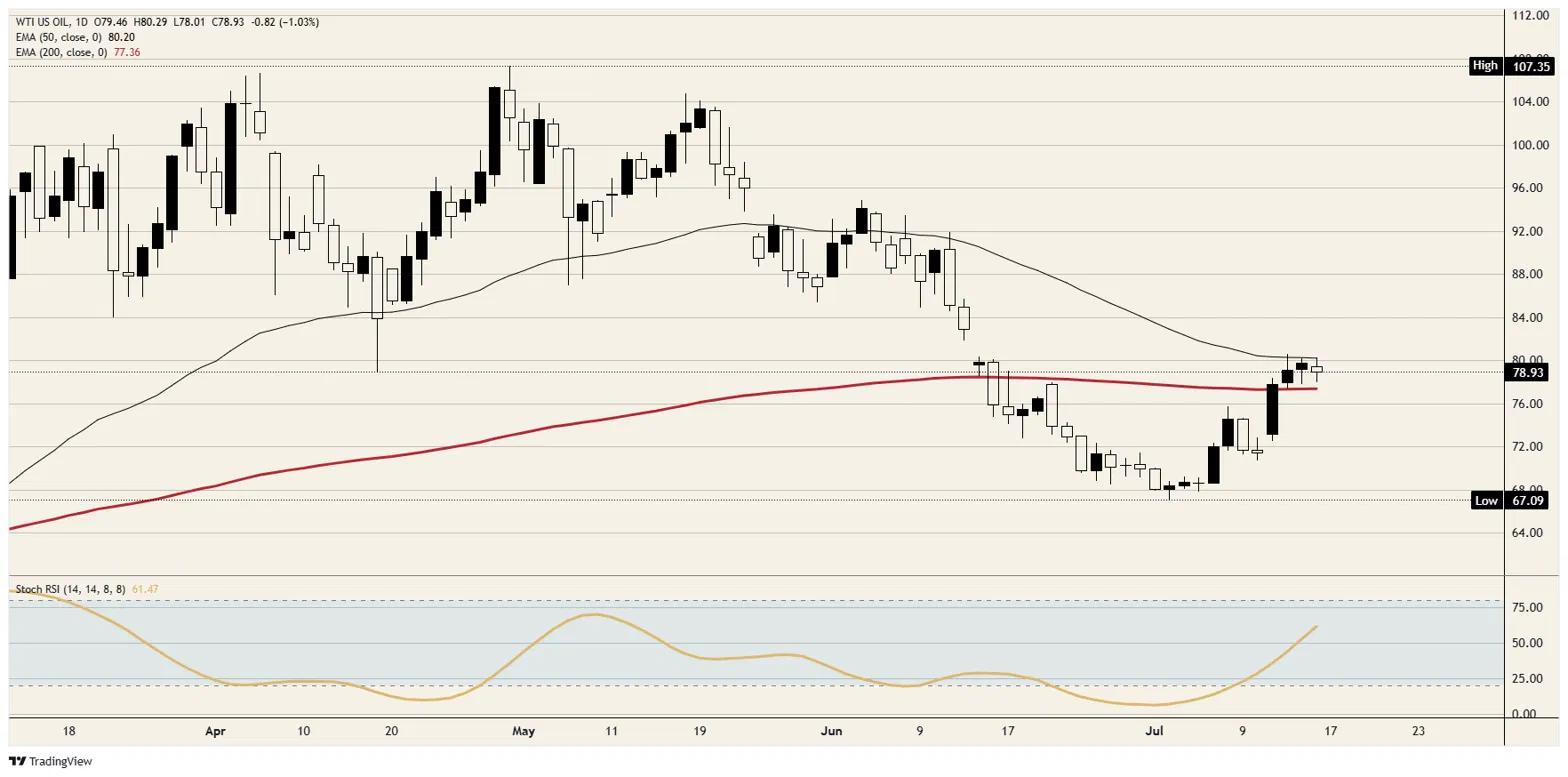
West Texas Intermediate (WTI) Crude Oil is fading about one percent to just below $79.00 after a third consecutive failure at the $80.00 handle, where the 50-day Exponential Moving Average sits just above the figure and refuses to yield. The rebound from the early-July low near $67.00 has been fast and joyless, and it has now stalled at precisely the level the chart said it would, with the daily Stochastic Relative Strength Index still pointed higher into the ceiling.
A war premium with a receipt
The overnight escalation list would have commanded a $30.00 premium in February. US forces widened their campaign with a strike on a tanker near Iran's main export terminal while the naval blockade of Iranian ports returned in force, and Tehran answered by firing at American bases in Kuwait and Jordan. Washington has floated a 20% transit toll for protected cargo through the Strait of Hormuz and revoked the waiver that let Tehran export Crude Oil and petrochemicals, and still the price cannot hold $80.00.
The market holds a receipt for this exact fear and remembers what it paid. WTI spent the spring above $107.00 pricing a sealed strait, watched last month's peace framework reopen the waterway, and rode the round trip all the way back to $67.00 within a fortnight of the signing. The June average alone shed better than $20.00 from May as tanker traffic surged back through the strait. Having paid full price once, traders now demand physically missing barrels before funding another premium, and headlines alone no longer clear that bar.
Too many barrels behind the fear
The sedative under the fear is a supply picture that keeps loosening. American production runs near a record 13.5 million barrels per day, output keeps building in Brazil, Guyana, and Canada, and forecasting agencies still pencil a surplus into late 2026 against demand growth near 1.2 million barrels per day. Iranian output had even climbed through the ceasefire weeks as sanctions relief kicked in, stocking buyers with cargoes before the blockade snapped back, so the barrels now lost were already discounted merchandise.
The cartel that would normally manage this has stopped pretending to. The United Arab Emirates walked out of the group in April, remaining members spent the ceasefire weeks lobbying to restore quotas and recover lost sales, and production discipline is the loosest it has been in decades. Record spare capacity concentrated in Saudi Arabia and its Gulf neighbours is what caps every rally, and that concentration is precisely the vulnerability.
Demand complicates the bear case only at the margin. Elevated energy prices this year produced remarkably little demand destruction, one reason inflation prints across the developed world carry an energy signature and central banks keep drifting hawkish. Firm consumption into growing supply still nets out to surplus, but it explains why the market's floor keeps rising even as its ceiling refuses to move.
The one threat the ceiling cannot absorb
The Yemen front reopened this week, and it aims at the insurance policy itself. Saudi Arabia struck Sanaa's airport in its first attack on the Houthis in roughly four years and the Houthis answered with ballistic missiles toward Abha, before the movement's leader used a Thursday address to declare every Saudi energy facility and vital installation a legitimate target. The group's political bureau brands the Bab al-Mandab Strait usable leverage, and Iran's Revolutionary Guard publicly endorsed shutting additional export routes. That corridor carries roughly a tenth of seaborne Crude Oil trade, and closing it to Saudi hulls would reroute the Kingdom's westbound barrels the long way around Africa.
A Hormuz disruption removes Iranian barrels the market has already written off, but a successful strike on Saudi processing would remove the spare capacity that underwrites the entire $80.00 ceiling, and 2019 already demonstrated how quickly that math changes. On the Dollar side, Michigan sentiment lands Friday at 14:00 GMT while rate futures keep a Federal Reserve hike live for the July 28-29 meeting, a hawkish backdrop leaning on every Dollar-priced barrel. The cap holds right up until a threat lands on the buffer itself.
Levels and bias
Resistance: The $80.00 handle reinforced by the 50-day Exponential Moving Average just above it caps the tape, ahead of $82.00 and the June breakdown shelf near $84.00.
Support: The $78.00 handle absorbed the session low, ahead of the 200-day Exponential Moving Average just below $77.50, with $76.00 next in line.
Bias: Lower. The tape is fading headlines that once bought double digits, the supply math wins until barrels actually go missing, and only a daily close above $80.50 flips the market from selling fear back to chasing it.
WTI spot daily chart
WTI Oil FAQs
WTI Oil is a type of Crude Oil sold on international markets. The WTI stands for West Texas Intermediate, one of three major types including Brent and Dubai Crude. WTI is also referred to as “light” and “sweet” because of its relatively low gravity and sulfur content respectively. It is considered a high quality Oil that is easily refined. It is sourced in the United States and distributed via the Cushing hub, which is considered “The Pipeline Crossroads of the World”. It is a benchmark for the Oil market and WTI price is frequently quoted in the media.
Like all assets, supply and demand are the key drivers of WTI Oil price. As such, global growth can be a driver of increased demand and vice versa for weak global growth. Political instability, wars, and sanctions can disrupt supply and impact prices. The decisions of OPEC, a group of major Oil-producing countries, is another key driver of price. The value of the US Dollar influences the price of WTI Crude Oil, since Oil is predominantly traded in US Dollars, thus a weaker US Dollar can make Oil more affordable and vice versa.
The weekly Oil inventory reports published by the American Petroleum Institute (API) and the Energy Information Agency (EIA) impact the price of WTI Oil. Changes in inventories reflect fluctuating supply and demand. If the data shows a drop in inventories it can indicate increased demand, pushing up Oil price. Higher inventories can reflect increased supply, pushing down prices. API’s report is published every Tuesday and EIA’s the day after. Their results are usually similar, falling within 1% of each other 75% of the time. The EIA data is considered more reliable, since it is a government agency.
OPEC (Organization of the Petroleum Exporting Countries) is a group of 12 Oil-producing nations who collectively decide production quotas for member countries at twice-yearly meetings. Their decisions often impact WTI Oil prices. When OPEC decides to lower quotas, it can tighten supply, pushing up Oil prices. When OPEC increases production, it has the opposite effect. OPEC+ refers to an expanded group that includes ten extra non-OPEC members, the most notable of which is Russia.
Recommended Articles


