

Crude Oil whips on Wednesday, surge in risk appetite sparks recovery in barrel bids
- WTI hits two-month low before recovering into familiar territory.
- US CPI inflation eased further, bolstering rate cut hopes.
- EIA barrel counts posted a steeper contraction than expected.
West Texas Intermediate (WTI) US Crude Oil sank to an eight-week low on Wednesday, tumbling below $76.40 before recovering into $78.40. Broad-market risk appetite surged during the US market session after falling US Consumer Price Index (CPI) inflation sparked further market hopes for Federal Reserve (Fed) rate cuts.
US CPI inflation eased in April, falling to 0.3% MoM compared to the forecast hold at 0.4%, and market bets on Fed rate cuts sparked a broad recovery in risk appetite, sending Crude Oil higher. Easing inflation helped bolster rate cut speculation, and the CME’s FedWatch Tool shows that rate markets are pricing in over 70% odds of a September rate trim from the Fed.
According to the Energy Information Administration (EIA), week-on-week Crude Oil Stocks Change fell faster than expected. EIA barrel counts decreased by -2.508 million barrels in the week ended May 10, below the forecast -1.35 million and slipping further back from the previous week’s -1.362 million barrel decline. With US Crude Oil reserves falling on a weekly basis, Crude Oil barrel bids found even further support as energy markets look for signs that US Crude Oil production will fail to meet or beat market demand.
WTI technical outlook
US Crude Oil dipped to a two-month low near $76.40 on Wednesday, tumbling through a near-term demand zone before quickly recovering back above the $78.00 handle. WTI remains on the bearish side, trading on the south side of the 200-hour Exponential Moving Average (EMA) at $78.70.
Daily candles show WTI stuck in recent consolidation, just below the 200-day EMA at $79.28 as energy markets struggle to develop bullish momentum. WTI is down around ten percent from April’s peaks near $87.00.
WTI hourly chart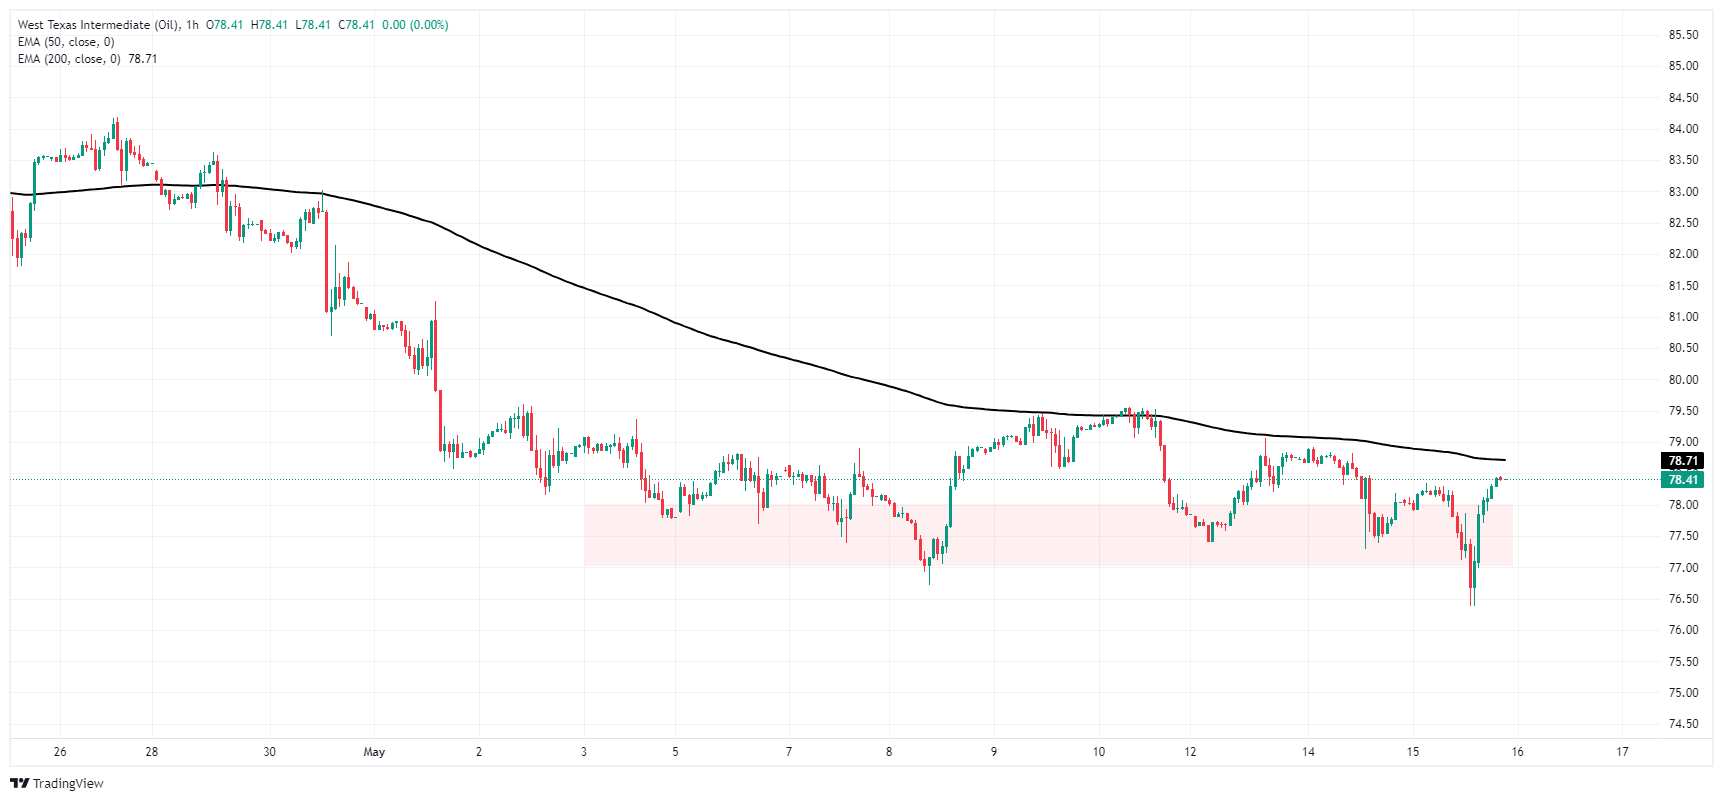
WTI daily chart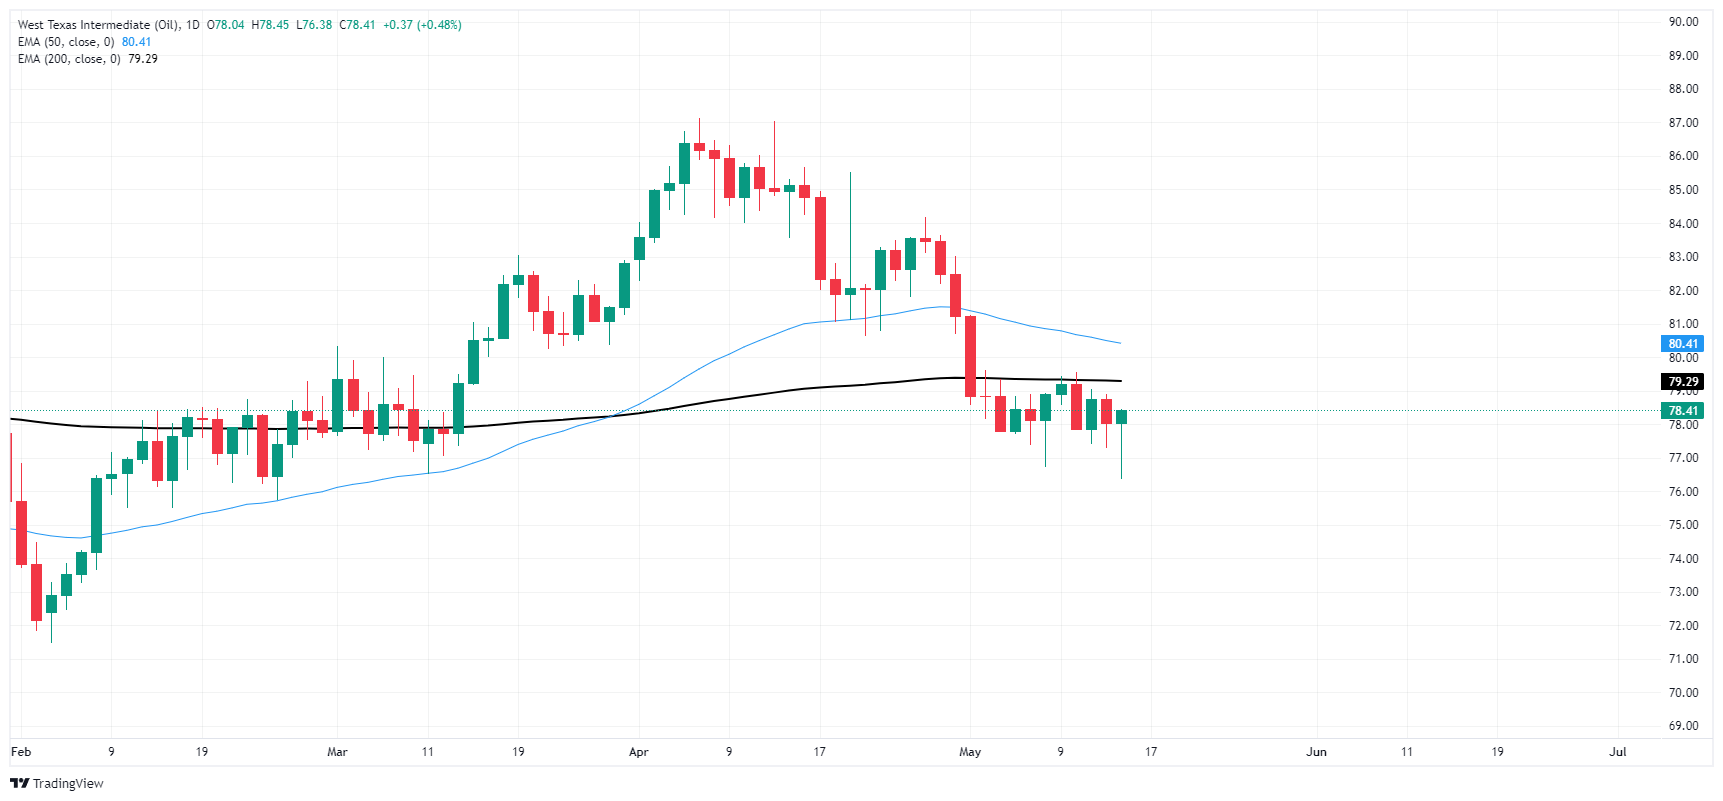
Recommended Articles


