
Gold approaches $3,700 as weak US Dollar, Fed rate cut bets drive rally
- Gold extends its record-breaking rally, trading just below the $3,700 psychological barrier on Tuesday.
- A broadly weak US Dollar and subdued Treasury yields keep the metal well supported ahead of Wednesday’s Fed decision.
- US Retail Sales and Industrial Production data due later on Tuesday could influence near-term momentum.
Gold (XAU/USD) extends its record-breaking rally on Tuesday, trading just shy of the $3,700 psychological level. The precious metal continues to draw strength from a broadly weaker US Dollar (USD) and falling US Treasury yields, as traders position ahead of the Federal Reserve’s (Fed) monetary policy decision on Wednesday.
The Greenback remains under broad pressure with the US Dollar Index (DXY) falling to multi-week lows, reflecting broad-based weakness as markets fully price in a 25-basis-point (bps) Fed rate cut. Meanwhile, US Treasury yields stay subdued across the curve, reducing the opportunity cost of holding non-yielding assets like Gold.
With the September rate cut widely seen as a done deal, investors will be closely watching the Fed’s updated economic projections and dot plot. Markets will be parsing Fed Chair Jerome Powell’s press conference for clues on how far and how fast the easing cycle could extend. A cautious or less dovish tone could trigger a near-term pullback, while confirmation of a steady easing path may keep bullion firmly bid above recent highs.
In the meantime, attention turns to US Retail Sales figures due later on Tuesday. Weak consumer spending would support the dovish narrative, while stronger spending data could test Gold’s momentum.
Market movers: Markets eye Fed decision amid political pressure
- The Fed’s monetary policy meeting takes place under unusual strain, with US President Donald Trump seeking greater sway over monetary decisions and legal challenges targeting the central bank’s leadership.
- Trump ramped up pressure on the Fed ahead of Wednesday’s decision, urging Chair Powell on Truth Social to deliver a rate cut larger than anticipated. The US President argued that a more aggressive move is long overdue and would provide a strong boost to the housing market.
- On Monday, a US appeals court blocked an attempt to remove Fed Governor Lisa Cook, ruling that President Trump’s claims did not meet the “for cause” threshold required by law. Cook is therefore expected to vote at Wednesday’s policy meeting.
- In a narrow 48-47 Senate vote, Stephen Miran, a top economic adviser to President Trump, was confirmed to the Federal Reserve Board on Monday. Miran is expected to be seated in time to participate in Wednesday’s vote. Some analysts believe that he may advocate for a larger rate cut than markets currently expect, raising questions over political influence on the Fed’s policy path.
- Geopolitical tensions add another layer of support for Gold. Beyond the macro backdrop of a weaker US Dollar and subdued Treasury yields, heightened geopolitical risk is reinforcing safe-haven flows. Israel launched a major ground offensive in Gaza City on Tuesday, escalating its conflict with Hamas, while Ukraine intensified drone and missile strikes on Russian refineries, disrupting energy infrastructure.
- Along with Retail Sales, the US economic docket will feature Industrial Production. Retail Sales are expected to increase 0.2% in August from 0.5% in July. Industrial Production is projected to decrease by 0.1%.
Technical analysis: XAU/USD at record highs, bulls eye $3,700 barrier
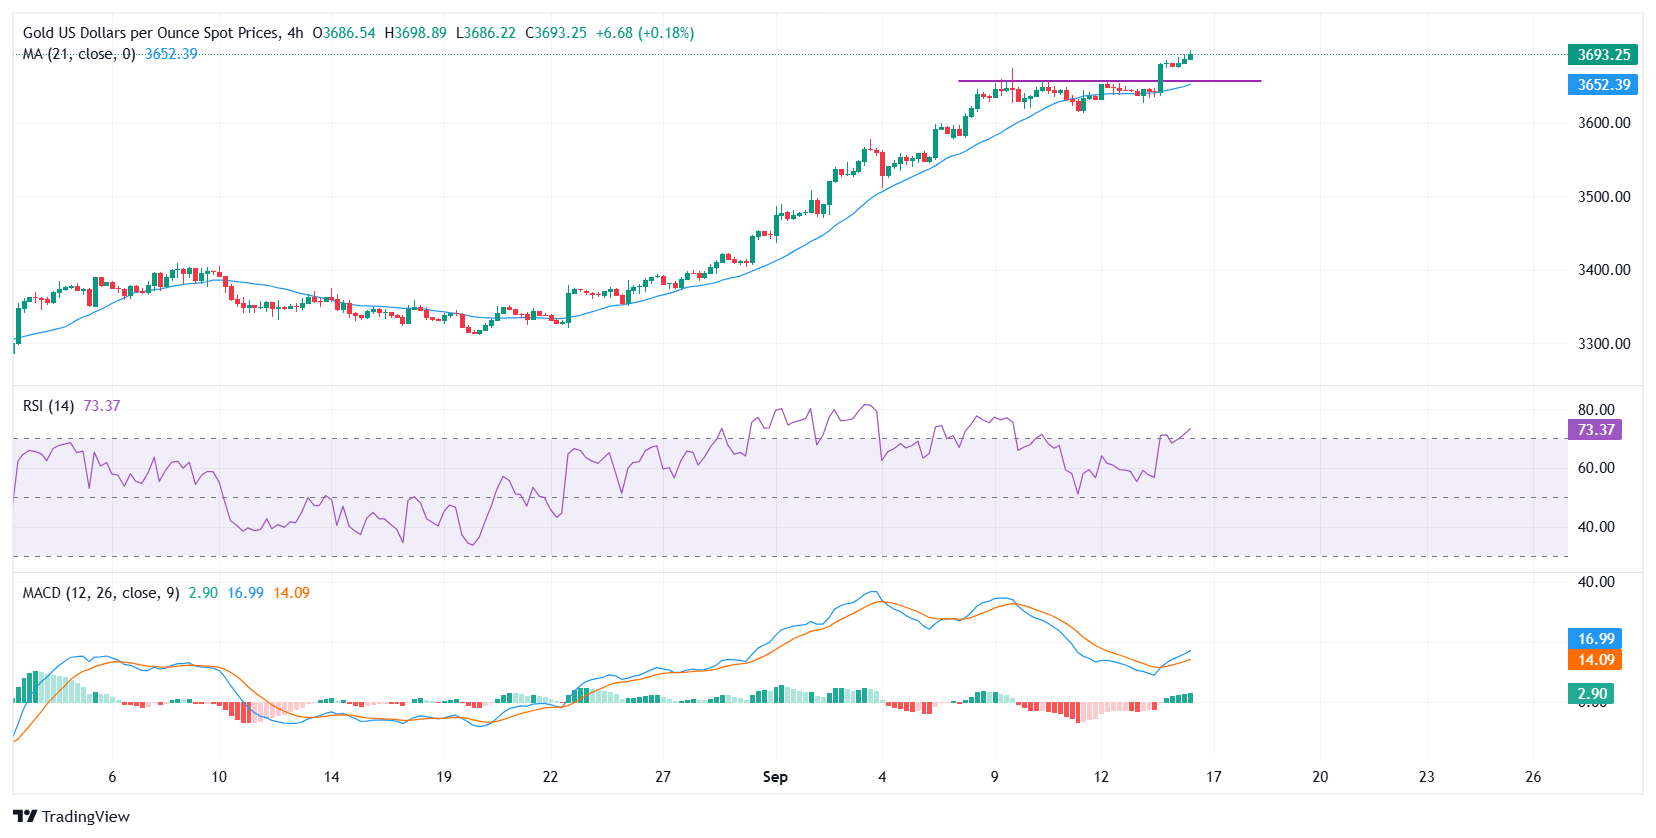
XAU/USD spent most of last week consolidating in a narrow range between $3,620 and $3,650 after notching a record high at around $3,675 on September 9. The consolidation phase ended with Monday’s breakout above $3,650, putting bulls firmly back in control.
At the time of writing, the metal is trading around $3,695, just shy of the $3,700 psychological barrier. The former peak at $3,675 now acts as immediate support, followed by the 21-period Simple Moving Average on the 4-hour chart near $3,652. A decisive break below this zone could expose $3,620 as the next downside level. On the upside, a sustained break through $3,700 would open the way for an advance toward $3,730-$3,750.
The Relative Strength Index (RSI) is holding at 73, firmly in overbought territory. This suggests that while buying momentum is strong, the market may be vulnerable to short-term pullbacks or profit-taking around the $3,700 barrier.
Meanwhile, the Moving Average Convergence Divergence (MACD) has turned higher after last week’s sideways grind. The MACD line has crossed above the signal line, with the histogram printing green bars, underscoring the bullish setup.
Economic Indicator
Retail Sales (MoM)
The Retail Sales data, released by the US Census Bureau on a monthly basis, measures the value in total receipts of retail and food stores in the United States. Monthly percent changes reflect the rate of changes in such sales. A stratified random sampling method is used to select approximately 4,800 retail and food services firms whose sales are then weighted and benchmarked to represent the complete universe of over three million retail and food services firms across the country. The data is adjusted for seasonal variations as well as holiday and trading-day differences, but not for price changes. Retail Sales data is widely followed as an indicator of consumer spending, which is a major driver of the US economy. Generally, a high reading is seen as bullish for the US Dollar (USD), while a low reading is seen as bearish.
Read more.Next release: Tue Sep 16, 2025 12:30
Frequency: Monthly
Consensus: 0.2%
Previous: 0.5%
Source: US Census Bureau
Retail Sales data published by the US Census Bureau is a leading indicator that gives important information about consumer spending, which has a significant impact on the GDP. Although strong sales figures are likely to boost the USD, external factors, such as weather conditions, could distort the data and paint a misleading picture. In addition to the headline data, changes in the Retail Sales Control Group could trigger a market reaction as it is used to prepare the estimates of Personal Consumption Expenditures for most goods.
Recommended Articles


