

Top 3 Price Prediction: BTC steadies, ETH finds support, XRP breaks bullish pattern

- Bitcoin Drops to $70,000. U.S. Government Refuses to Bail Out Market, End of Bull Market or Golden Pit?
- Gold rallies further beyond $5,050 amid flight to safety, dovish Fed expectations
- Bitcoin Bottom Debate: $70,000 or $50,000?
- A Crash After a Surge: Why Silver Lost 40% in a Week?
- Bitcoin Rout. Bridgewater Founder Dalio Publicly Backs Gold.
- WTI declines below $63.00 as US-Iran talks loom

Bitcoin price holds steady below resistance at $116,000, with a breakout likely to trigger a fresh bullish leg.
Ethereum price finds support after reclaiming the upper range boundary at $4,488 on Friday.
Ripple price confirms a breakout above a falling wedge pattern, indicating renewed bullish momentum.
Bitcoin (BTC), Ethereum (ETH), and Ripple (XRP) hover around key levels after recovering by nearly 4%, 7%, and 6%, respectively, last week. At the start of this week, BTC is hovering below its key resistance level at $116,000, while ETH and XRP show signs of resilience that could fuel further upside momentum.
Bitcoin could hit $120,000 if it closes above $116,000
Bitcoin price continued its second consecutive week of recovery, increasing by 3.72% last week. However, it found resistance around the $116,000 daily level on Saturday and declined slightly the next day. At the time of writing on Monday, it hovers around $115,300.
If BTC closes above the daily resistance level at $116,000 on a daily basis, it could extend the rally toward its psychological level at $120,000.
The Relative Strength Index (RSI) on the daily chart reads 56, which is above its neutral level of 50, showing that bullish momentum is gaining traction. The Moving Average Convergence (MACD) indicator displayed a bullish crossover on September 6, which remains in effect, indicating sustained bullish momentum and an upward trend ahead.
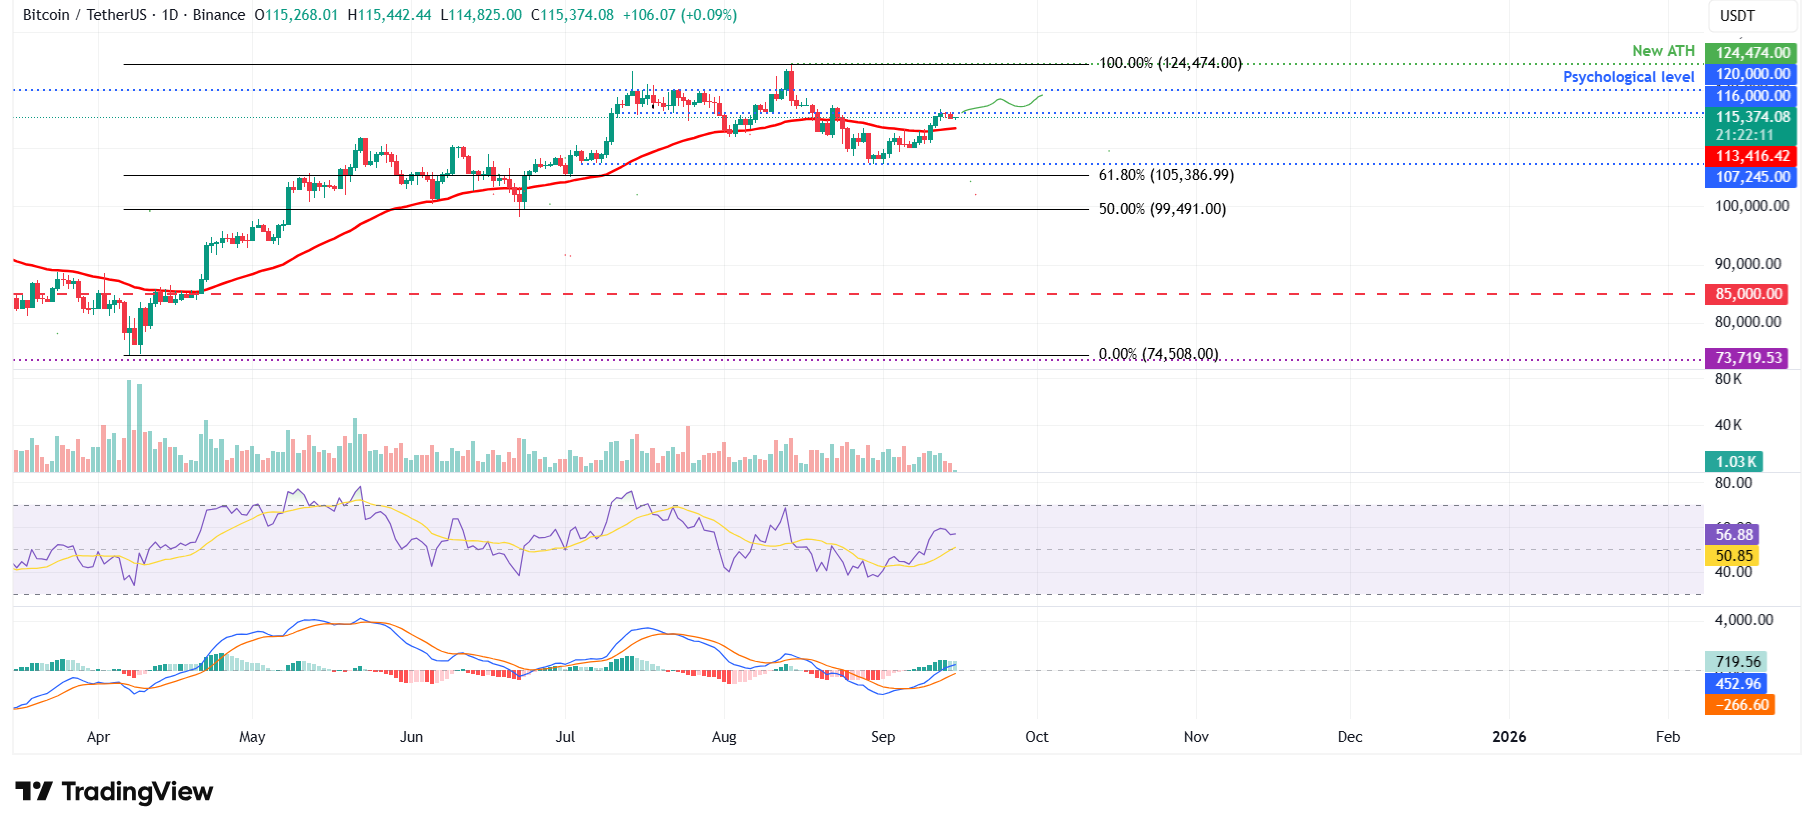
BTC/USDT daily chart
On the contrary, if BTC fails to close above the $116,000 resistance level and continues to correct, it could extend the decline toward its 50-day Exponential Moving Average (EMA) at $113,416.
Ethereum bulls aiming for record highs
Ethereum price broke above the upper consolidating boundary at $4,488 on Friday and rallied by 5.68%. However, it failed to maintain its upward momentum and declined 2.25% in the next two days. At the time of writing on Monday, it trades at around $4,620.
If ETH finds support around the upper consolidating boundary at $4,488, it could extend the rally towards its record high at $4,956.
The RSI on the daily chart reads 59 above its neutral level of 50, showing that bullish momentum is gaining traction. The MACD exhibited a bullish crossover on Friday, providing a buy signal and further bolstering the bullish thesis.
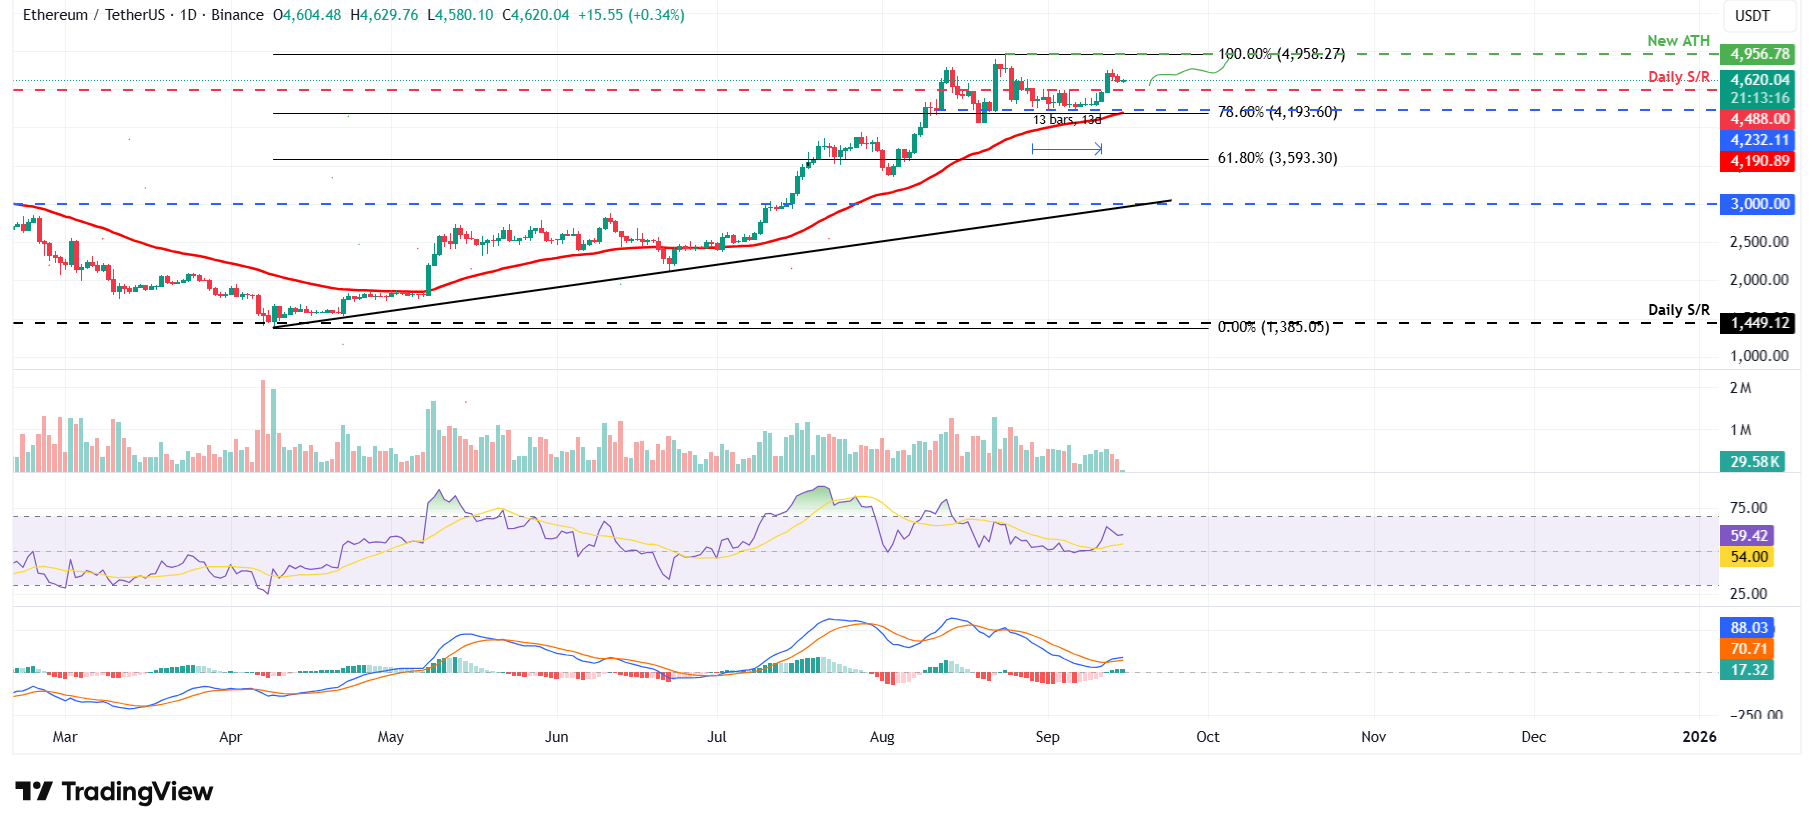
ETH/USDT daily chart
However, if ETH closes below the $4,488 level, it could extend the decline toward the lower boundary at $4,232.
XRP breaks above falling wedge pattern
Ripple price broke above the falling wedge pattern (drawn by connecting multiple highs and lows with two trendlines since mid-July) on Thursday; a breakout of this pattern favors the bulls. XRP rallied 2.5% in the next two days but declined slightly on Sunday. At the time of writing on Monday, it hovers around $3.03.
If XRP continues its upward momentum, it could extend the rally toward its daily resistance at $3.40.
Like Bitcoin and Ethereum, XRP’s RSI stands above the neutral level of 50, indicating bullish momentum. Additionally, the MACD showed a bullish crossover last week, which remains in effect, indicating sustained bullish momentum and an upward trend ahead.
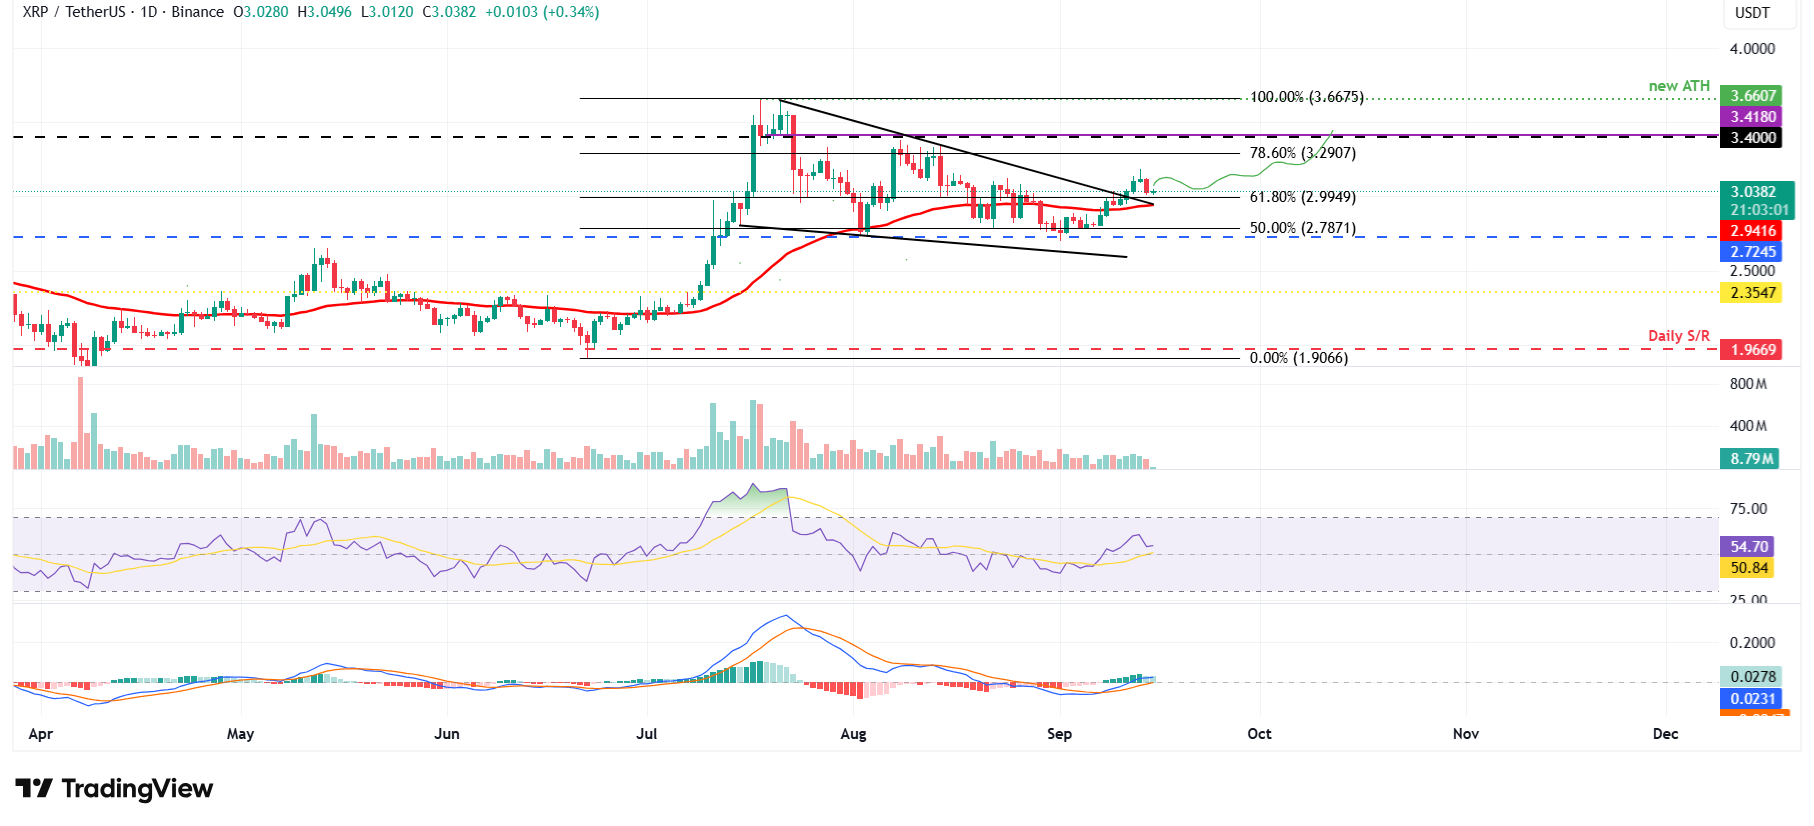
XRP/USDT daily chart
On the other hand, if XRP faces a correction, it could extend the decline toward its 50-day EMA at $2.94.
Read more
* The content presented above, whether from a third party or not, is considered as general advice only. This article should not be construed as containing investment advice, investment recommendations, an offer of or solicitation for any transactions in financial instruments.


