Oil Price Analysis: Consolidating within a short-term uptrend

Source Fxstreet
  • WTI Oil is in a short-term uptrend within a rising price channel. 
  • The commodity has pulled back and is consolidating – its next move could be critical. 
  • A move below the range lows could flip the trend bearish; a rise above the March high bullish.  

WTI Oil price (OIL) is trading within an ascending channel whose rising peaks and troughs indicate the commodity is in a short-term uptrend. 

Given the old adage that “the trend is your friend till the bend at the end,” the price is favored to continue rising in the short-term until the weight of evidence suggests it has reversed. 
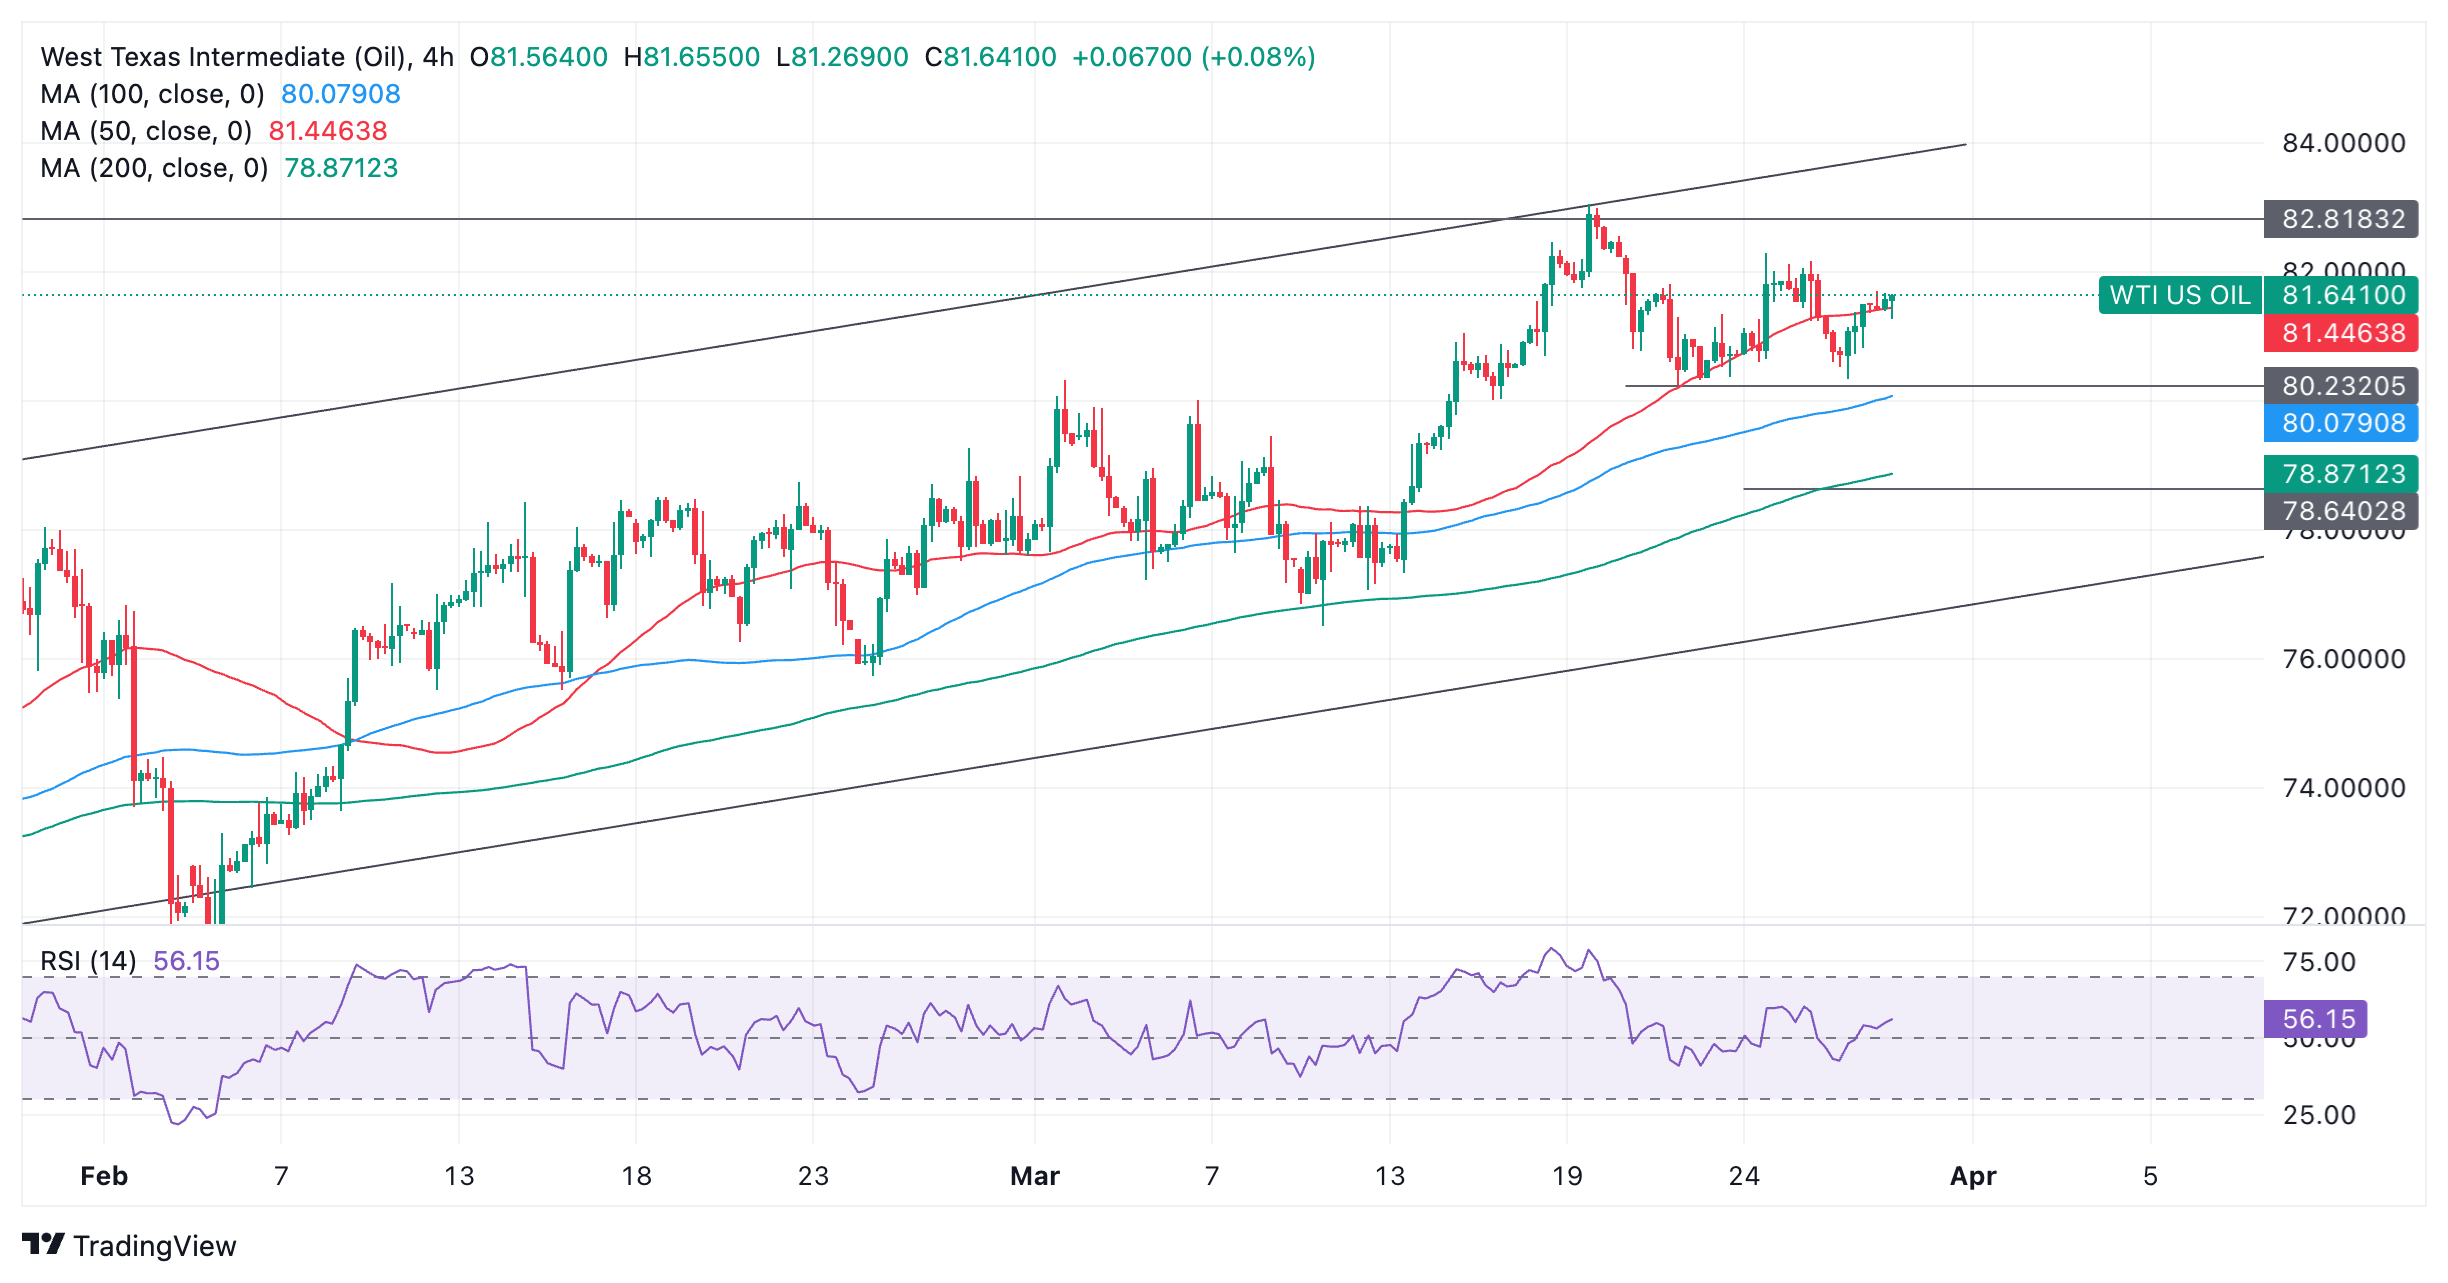
WTI Oil: 4-hour chart

The trend on longer time frames is less clear, suggesting some caution needs to be taken in adopting an overly bullish view. 

On March 19, Oil price peaked at $83.05 before rolling over. A combination of resistance from the 100-week Simple Moving Average (SMA) (not shown) and the top of the price channel were probably the catalysts for the rejection. 

Oil price has since yo-yoed in a range between roughly $80.20 and $82.00. 

Although the pair retains its short-term uptrend intact it is at risk of reversing lower unless it can print a higher high. 

A break below the $80.20 range lows would indicate peaks and troughs were now in a  falling pattern rather than rising, and that the short-term trend was bearish. This would start to push the odds in favor of bearish bets. 

Such a move would probably lead to a decline back down within the channel to an initial target at $78.60-80 where a combination of major Moving Averages converge, supplying dynamic support for the commodity. 

Alternatively a break above the $83.05 highs would indicate a continuation of the short-term uptrend, with the next possible target in the upper $83.00s, perhaps $83.90 to put a number on it.  


Disclaimer: For information purposes only. Past performance is not indicative of future results.
placeholder
USD/CAD Price Forecast: Eyes fresh six-month highs near 1.4150 within overbought zoneThe technical analysis of the daily chart indicates a prevailing bullish bias, with the pair remaining within the ascending channel pattern.
Author  FXStreet
Nov 07, Fri
The technical analysis of the daily chart indicates a prevailing bullish bias, with the pair remaining within the ascending channel pattern.
placeholder
Dow Jones futures gain amid easing US-China tensions, Michigan Consumer Sentiment awaitedDow Jones futures advance 0.20% to trade above 47,100 during European hours ahead of the opening of the United States (US) regular session on Friday.
Author  FXStreet
Nov 07, Fri
Dow Jones futures advance 0.20% to trade above 47,100 during European hours ahead of the opening of the United States (US) regular session on Friday.
placeholder
Gold draws support from safe-haven flows and Fed rate cut betsGold catches fresh bids on the last day of the week amid reviving safe-haven demand.
Author  FXStreet
Nov 07, Fri
Gold catches fresh bids on the last day of the week amid reviving safe-haven demand.
placeholder
WTI Price Forecast: Trades with modest gains below $60.00; not out of the woods yetFrom a technical perspective, the black liquid has been trending lower along a downward-sloping channel since late October.
Author  FXStreet
Nov 07, Fri
From a technical perspective, the black liquid has been trending lower along a downward-sloping channel since late October.
placeholder
GBP/USD edges lower to near 1.3100 on potential for further BoE rate cutsThe pair depreciates as the Pound Sterling (GBP) weakens following the Bank of England’s (BoE) dovish hold in November.
Author  FXStreet
Nov 07, Fri
The pair depreciates as the Pound Sterling (GBP) weakens following the Bank of England’s (BoE) dovish hold in November.
goTop
quote