
Contrarian Series: With Oil Prices Hitting a Four-Year Low, Is a Trend Reversal on the Horizon?
1. Introduction
TradingKey - As markets worldwide hold their breath ahead of the Federal Reserve’s September FOMC meeting, uncertainty mirrors that of exactly one year ago, when the Fed unexpectedly cut rates by 50 bps. Although Jerome Powell struck a relatively dovish tone at recent global central bank forums, investors remain focused on the upcoming August inflation and employment data. These figures will be critical in gauging whether the Fed will cut rates in September, and if so, whether the size of the cut will surpass market expectations.
Meanwhile, Brent crude and WTI prices have slid to lows near $66 and $63 per barrel respectively—the lowest levels since 2021—while sentiment toward oil has deteriorated to levels not seen in two decades.
.jpg)
Data Sources: Bloomberg, TradingKey As of: August 28, 2025
Following my previous report on commodities — “U.S. Manufacturing Revival and a Softening Dollar: Why Commodity ETFs Could Be the Next Investment Frontier” , this article focuses on oil—one of the most significant commodities in global markets. Using a fundamental research framework, we aim to assess the medium-to-long-term outlook for oil prices, providing investors with informed guidance amid prevailing market uncertainties.
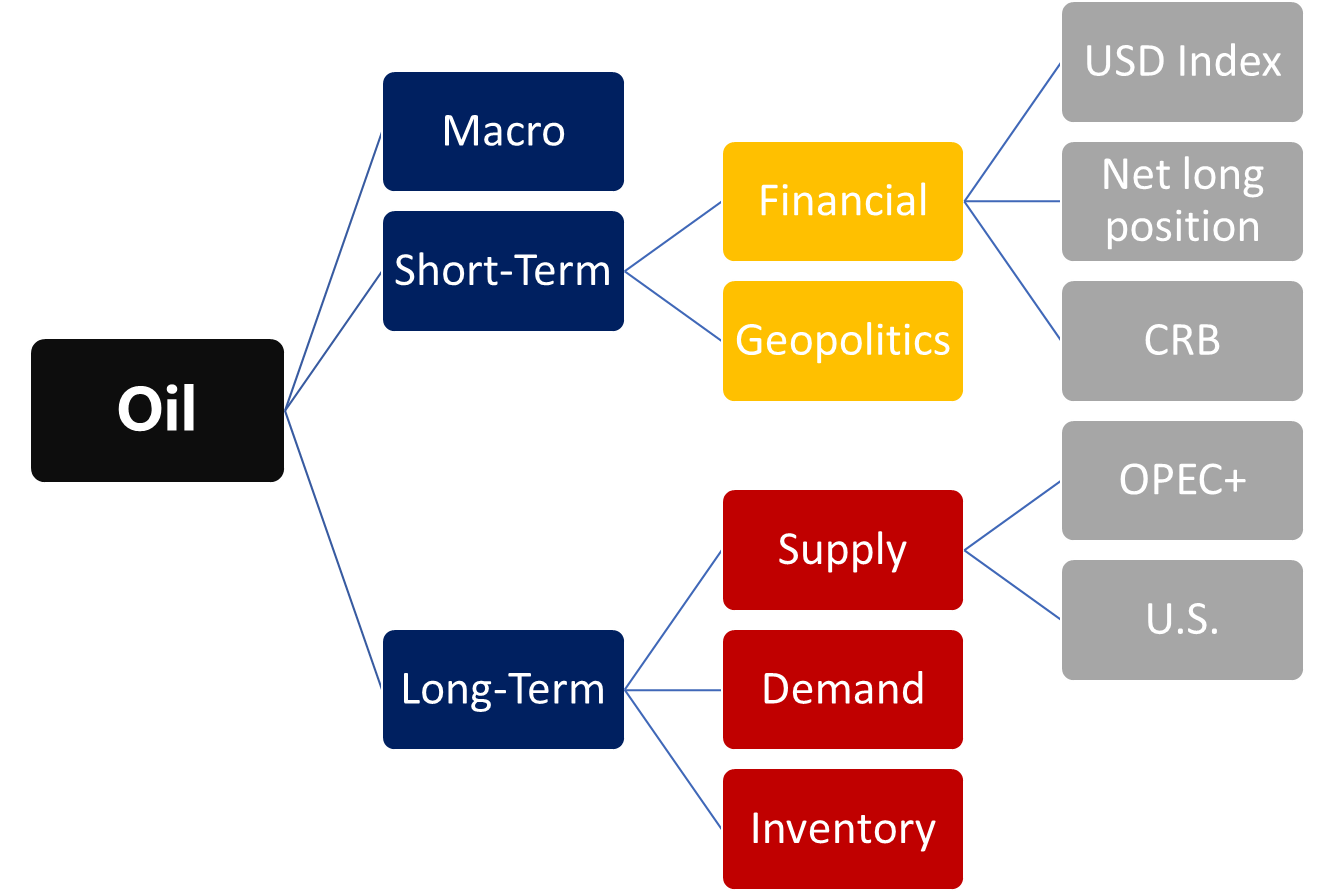
2. Oil Research Framework
Unlike gold, which carries both commodity and financial attributes, oil is chiefly a commodity without intrinsic financial or monetary characteristics. The main drivers of commodity prices remain supply, demand, and inventory dynamics, though financial factors, macroeconomic shifts, and geopolitical risks also frequently interfere.
3. Oil Supply
The global supply elasticity of crude oil has notably increased following the pandemic shock. In 2020, output fell by 6.43 million barrels per day compared to 2019 due to COVID-19 disruptions. However, boosted by expansive global monetary policy, manufacturing recovery, and increased capital expenditures by oil producers, global oil production has rebounded steadily over the past four years. By 2024, average daily output is expected to reach 103 million barrels per day, surpassing pre-pandemic levels.
Since the formation of OPEC+ in 2016, the global oil supply landscape has become dominated by this duopoly of OPEC+ and the United States.
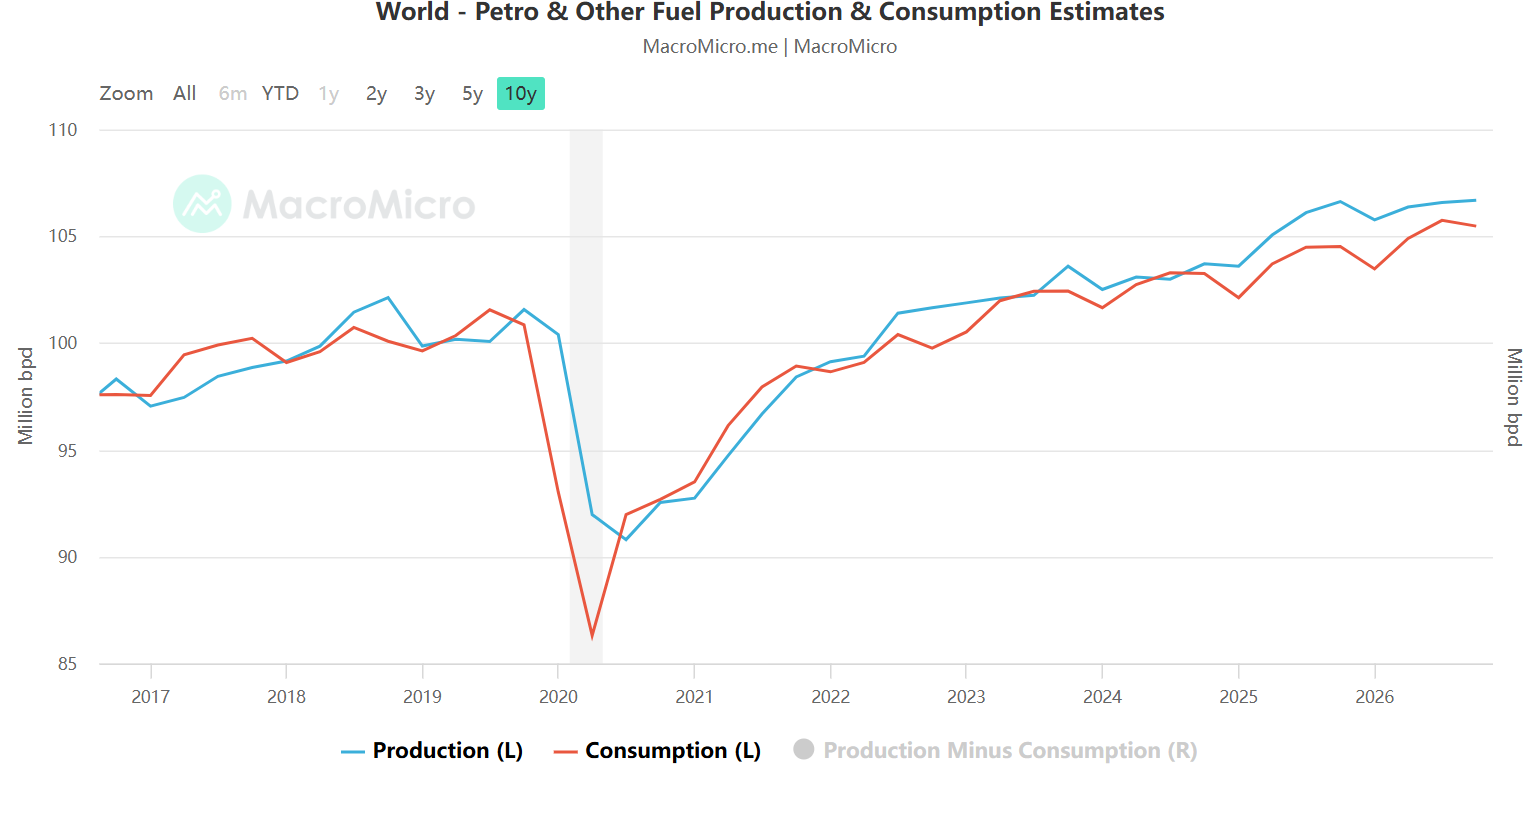
Data Sources: MacroMicro, TradingKey As of: August 28, 2025
3.1 OPEC+
The core assumption underpinning the oil supply analysis is the concept of depletion rates. Essentially, global oil reserves decline over time unless new discoveries or technological innovations emerge—such as the U.S. adoption of hydraulic fracturing in shale extraction. As of the end of 2024, proven global oil reserves stand at approximately 1.77 trillion barrels, with OPEC members holding 1.22 trillion barrels, representing 70% of the total.
Given current global reserves and an average daily consumption of about 105 million barrels, oil reserves are projected to be exhausted within 40 to 47 years. Under this long-term depletion outlook, elasticity in supply primarily depends on profitability, i.e., the margin between market price and production cost.
A common misconception is that Middle Eastern oil production costs are very low, allowing producers there a greater tolerance for price drops downstream. In reality, for major exporters like Saudi Arabia, the UAE, and Russia, the relevant “break-even” costs derive not from simple extraction expenses but from the fiscal balances needed to sustain their budgets via oil export revenues.
Accordingly, production costs for many Middle Eastern producers are considerably higher than the oft-quoted $10-15 per barrel. For instance,Kazakhstan’s costs peaked at $183.5 per barrel in 2021, while Saudi Arabia and Iran’s breakeven prices stood at $83.6 and $118 per barrel, respectively.
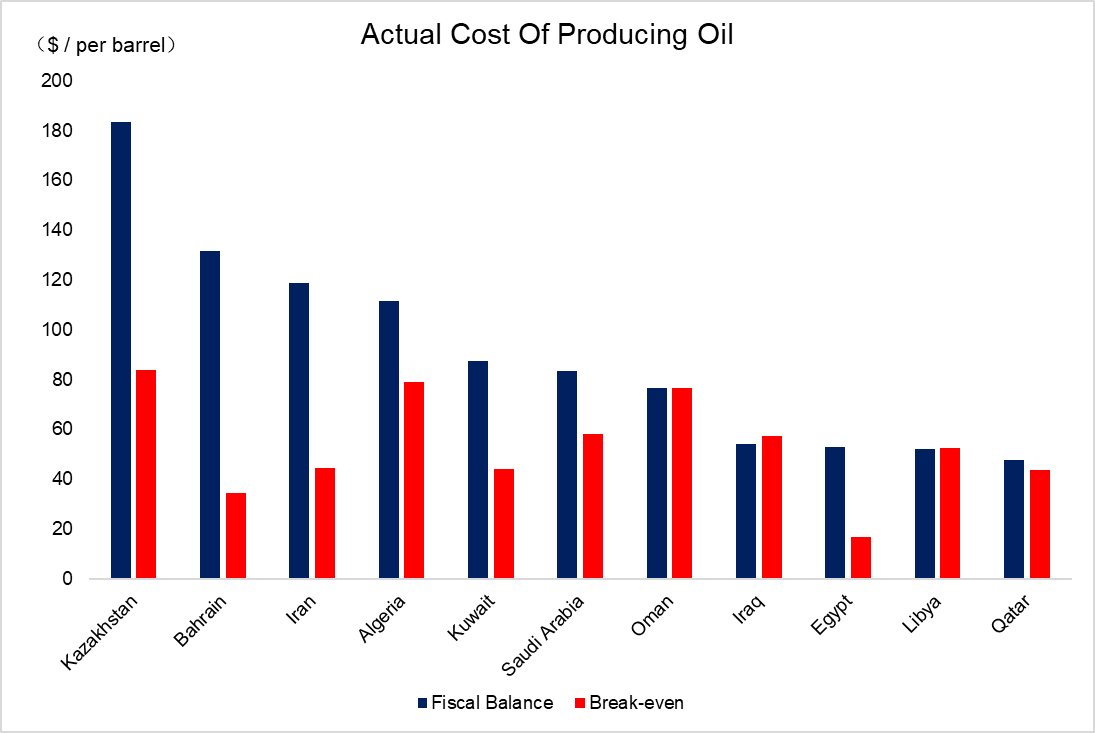
Data Sources: IEA, TradingKey As of: August 28, 2025
OPEC’s theoretical spare capacity stands at approximately 2 million barrels per day over the next 12 to 18 months. However, actual increases depend heavily on policy choices by core producers such as Saudi Arabia and the UAE. In the current environment of falling prices, considering national production costs, the likelihood of expansion is low. Should prices fall below $60 per barrel, OPEC+ could suspend its incremental supply or potentially initiate fresh production cuts.
3.2 U.S.
U.S. crude output surged following the shale revolution, climbing rapidly since 2009 to around 13.3 million barrels per day, propelling the U.S. from a net importer to the world’s largest oil producer. The enactment of the “OBBB Act” under the previous administration has further cemented U.S. ambitions for increased energy exports.
However, shale production cycles are notably short-lived and subject to rapid decline rates. While a well can be drilled and brought online within 4-6 months—a stark contrast to the roughly three-year timelines in Middle Eastern fields—its output typically falls 70% in the second year, followed by a 30% drop in the third year. This makes drilling activity highly sensitive to price signals, which in turn shapes capital expenditure decisions.
Interestingly, the number of active rigs serves as a leading indicator for future production, as changes beyond expectations materially affect output and prices.
Another useful metric is the count of DUCs—“drilled but uncompleted wells.” These wells represent potential future supply once completed and brought online. As of the end of July 2025, U.S. DUC inventory stood at just 5,238 wells, the lowest level in over a decade. This scarcity reflects shale producers’ cautious stance amid uncertainties about the future trajectory of global oil demand, signaling restrained investment and indicating that the U.S. supply side may remain tightly constrained in the near to medium term.
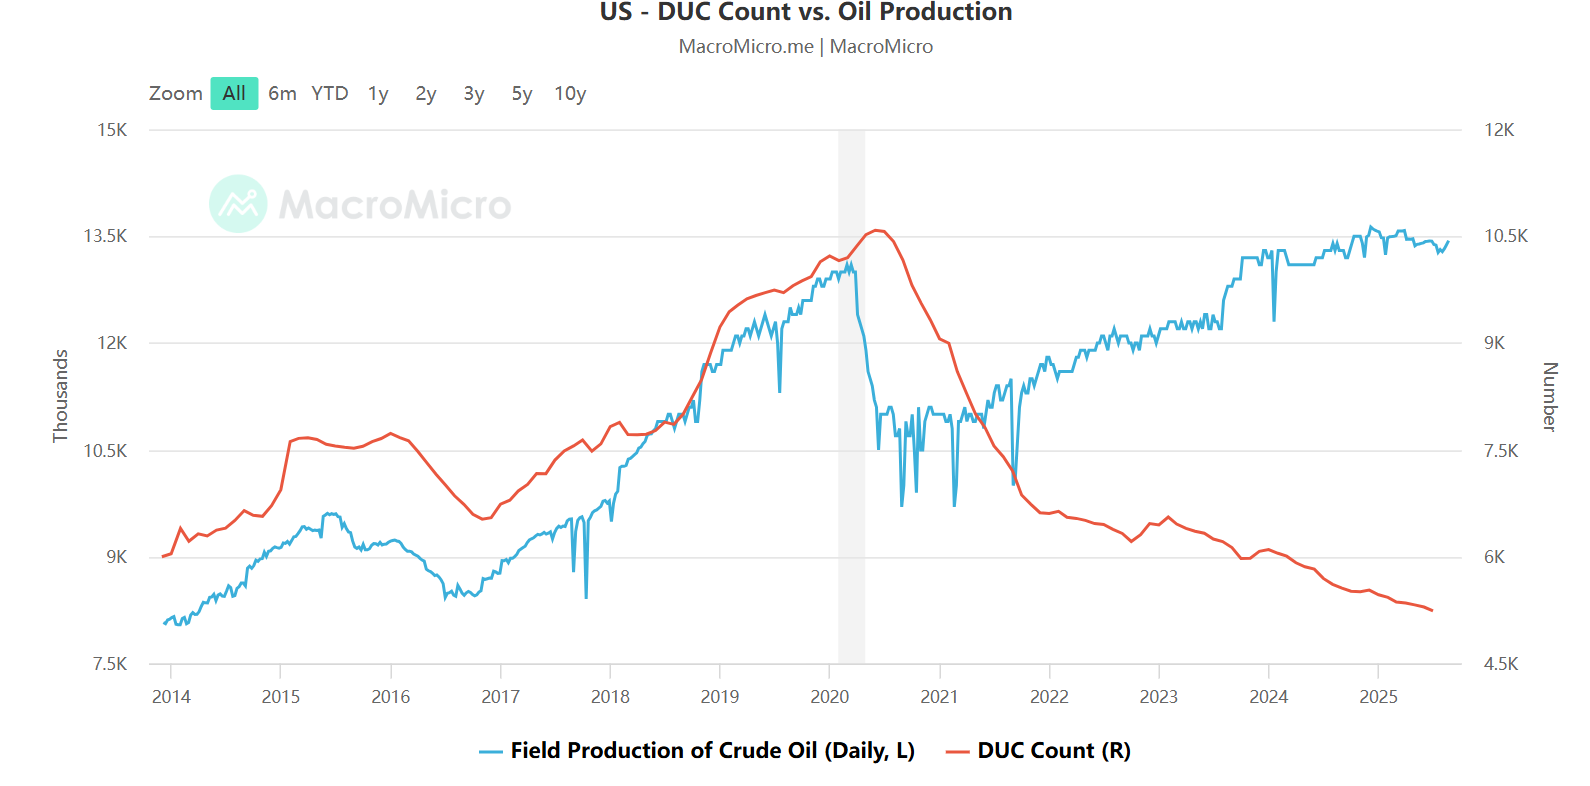
Data Sources: MacroMicro, TradingKey As of: August 28, 2025
4. Oil Demand
From a medium- to long-term perspective, global crude oil demand is closely linked to overall economic growth. Post-pandemic, as the global economy gradually recovered, annual global oil consumption returned to pre-COVID levels by 2022, signaling a significant easing of the pandemic’s economic impact. Despite supply shocks arising from geopolitical conflicts such as the Russia-Ukraine war, demand has remained broadly resilient.
Looking ahead, the global economy is expected to slow down noticeably compared with the past five years. The IMF’s latest projections forecast growth rates of 2.8% in 2025 and 3.0% in 2026, implying that crude oil demand will likely grow only modestly. Taking China and the U.S.—the two largest oil consumers—as examples, there is a strong positive correlation between macroeconomic performance and end-demand. Furthermore, manufacturing PMIs across major economies show a direct relationship with oil consumption volumes.
5. Oil Inventories
Typically, changes in crude oil inventories—whether stock builds or draws—cause parallel movements in refined product prices, and vice versa. These cycles can temporarily cause oil prices to deviate from their long-term equilibrium.
Looking specifically at U.S. oil inventories, including strategic reserves, we see a sustained downward trend since 2020. Total stocks have fallen from a peak of approximately 2.1 billion barrels to around 1.65 billion barrels weekly. Current U.S. reserves are at levels not seen since the early 2000s. The likelihood of a sharp decline in oil prices is low. Instead, with the onset of a new rate-cutting cycle, real economic activity is expected to drive gradually increasing energy demand, ushering in a phase of inventory replenishment.
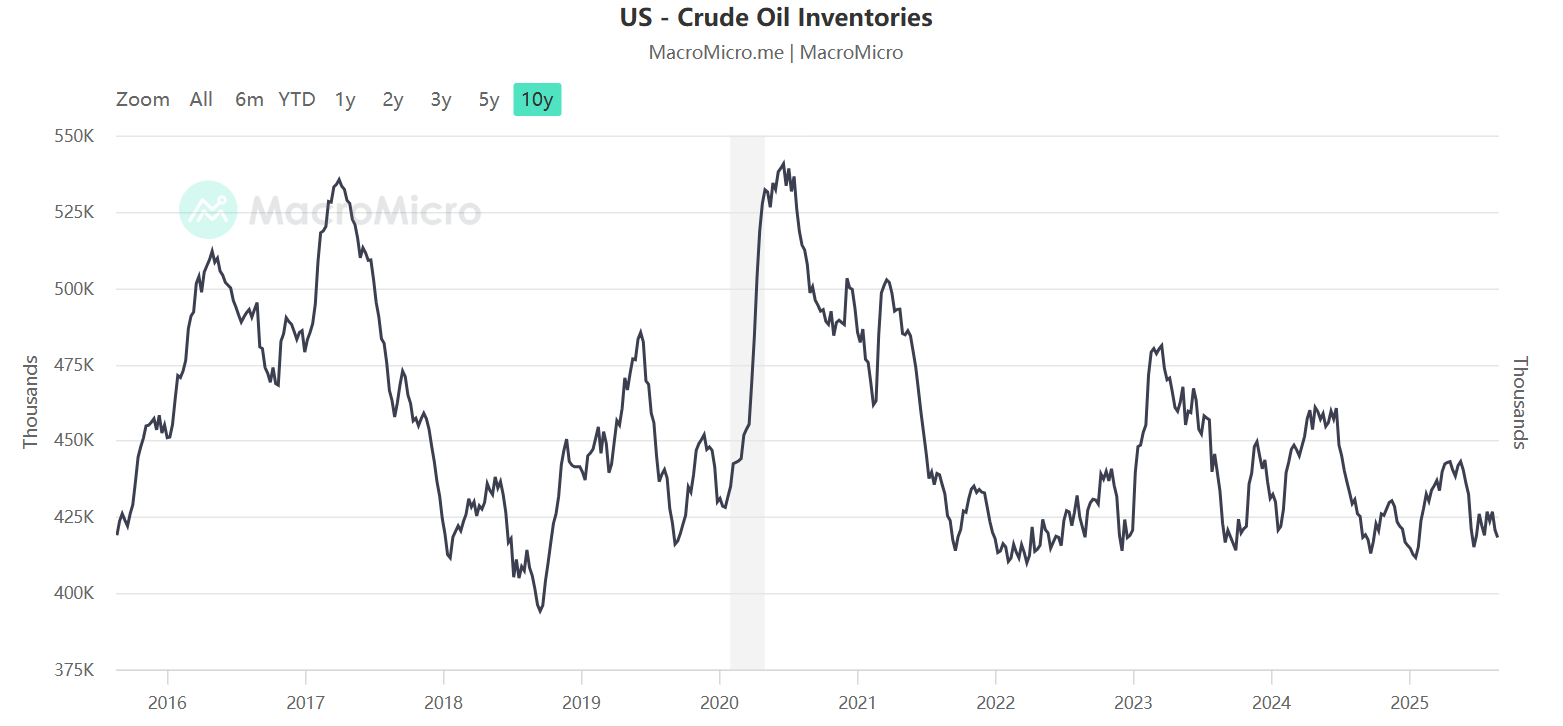
Data Sources: MarcoMicro, TradingKey As of: August 28, 2025
6. Impact of Other Factors
While fundamental supply-demand dynamics and inventory levels primarily dictate medium- to long-term oil prices, geopolitical and political risks often exert outsized influence on short-term price volatility.
For instance, recent meetings between Trump and Putin seeking Russia-Ukraine peace talks could, if successful, lead to the lifting of sanctions on Russia. This would likely increase Russian oil exports and weigh heavily on prices. However, given the complex web of international interests, particularly U.S. allies’ reluctance to sacrifice Ukraine’s position, such outcomes remain uncertain.
Similarly, recent sudden U.S. actions against Venezuela have revolved largely around control of oil supply chains. These geopolitical flashpoints frequently induce sharp but unpredictable short-term price swings, which are inherently difficult to forecast and thus remain outside the scope of our core analysis.
7. Conclusion
In summary, a relatively straightforward investment path emerges: while numerous complex factors influence international oil prices, oil’s commodity nature means that supply and demand dynamics remain the primary drivers of medium- to long-term price movements. Global economic growth expectations set the tone for demand changes, though with relatively low elasticity, while producing countries exert more effective control over prices through supply-side adjustments.
Currently, global oil prices have fallen to their lowest levels in nearly four years, prompting continuous declines in capital expenditures on oil and gas exploration—raising the risk of future supply shortages. Meanwhile, national oil inventories are sitting at historic lows, indicating an impending need for restocking.
Today’s pricing largely reflects a pessimistic outlook shaped by the lingering effects of the Trump-era trade war, expectations of a global economic slowdown, and a market share battle between OPEC+ and the U.S. via price-for-volume strategies. Unless there is a major geopolitical breakthrough—such as the lifting of sanctions on Iran or Russia—or a severe economic crisis unfolds, the probability of a significant further collapse in international oil prices remains low. Against the backdrop of anticipated interest rate cuts, major economies led by China and the U.S. are poised to implement substantial stimulus measures, which could boost demand for traditional energy and potentially reverse the current price downtrend.

Get Started
Recommended Articles


