
GBP/USD climbs above 1.3500 as solid U.S. data caps Dollar
- GBP/USD gains 0.19% as Dollar struggles despite US GDP crushing forecasts.
- Jobless claims edged lower to 229K, but NFP revisions show labor market cooled with weaker job creation.
- UK inflation pressures persist as factory prices hit two-year high, keeping BoE rate-hold expectations intact.
The GBP/USD rises during the North American session after economic data released in the United States (US) showed that the economy remains solid and does not warrant an interest rate cut. At the time of writing, the pair trades at 1.3524, up 0.19%.
Sterling firms as U.S. GDP beats estimates but jobless claims rise; BoE expected to hold policy steady
The Dollar has failed to gain traction, despite Gross Domestic Product (GDP) figures for Q2 exceeding estimates for 3.1% growth, which came in at 3.3% in the second estimate. In Q1, the economy contracted by -0.5%, according to the US Bureau of Economic Analysis.
The figures indicate that the economy is expected to grow at a moderate pace as businesses and households adjust to the current administration's trade policies.
At the same time, US Initial Jobless Claims for the week ending August 23 rose by 229K, below forecasts of 230K and the previous week 235K. Following the downward revision of Nonfarm Payroll figures at the beginning of the month, the statistics showed that the economy added 35K jobs per month during the last three months, compared to 123K in 2024 for the same period.
In the meantime, the British Pound is expected to appreciate as market participants anticipate a more hawkish Bank of England (BoE) following its last meeting, at which the Bank Rate was set at 4.25%.
During the week, Producer Prices in the UK hit a two-year high of 1.9% YoY. Expectations that the BoE would keep rates unchanged are fully priced in, according to the Prime Market Terminal Interest Rate Probability tool.
Ahead of the US economic docket will feature the release of the Federal Reserve’s (Fed) preferred inflation gauge, along with the Advance Goods Trade Balance. Additionally, traders will be watching the developments of the US President Trump's firing of Fed Governor Lisa Cook.
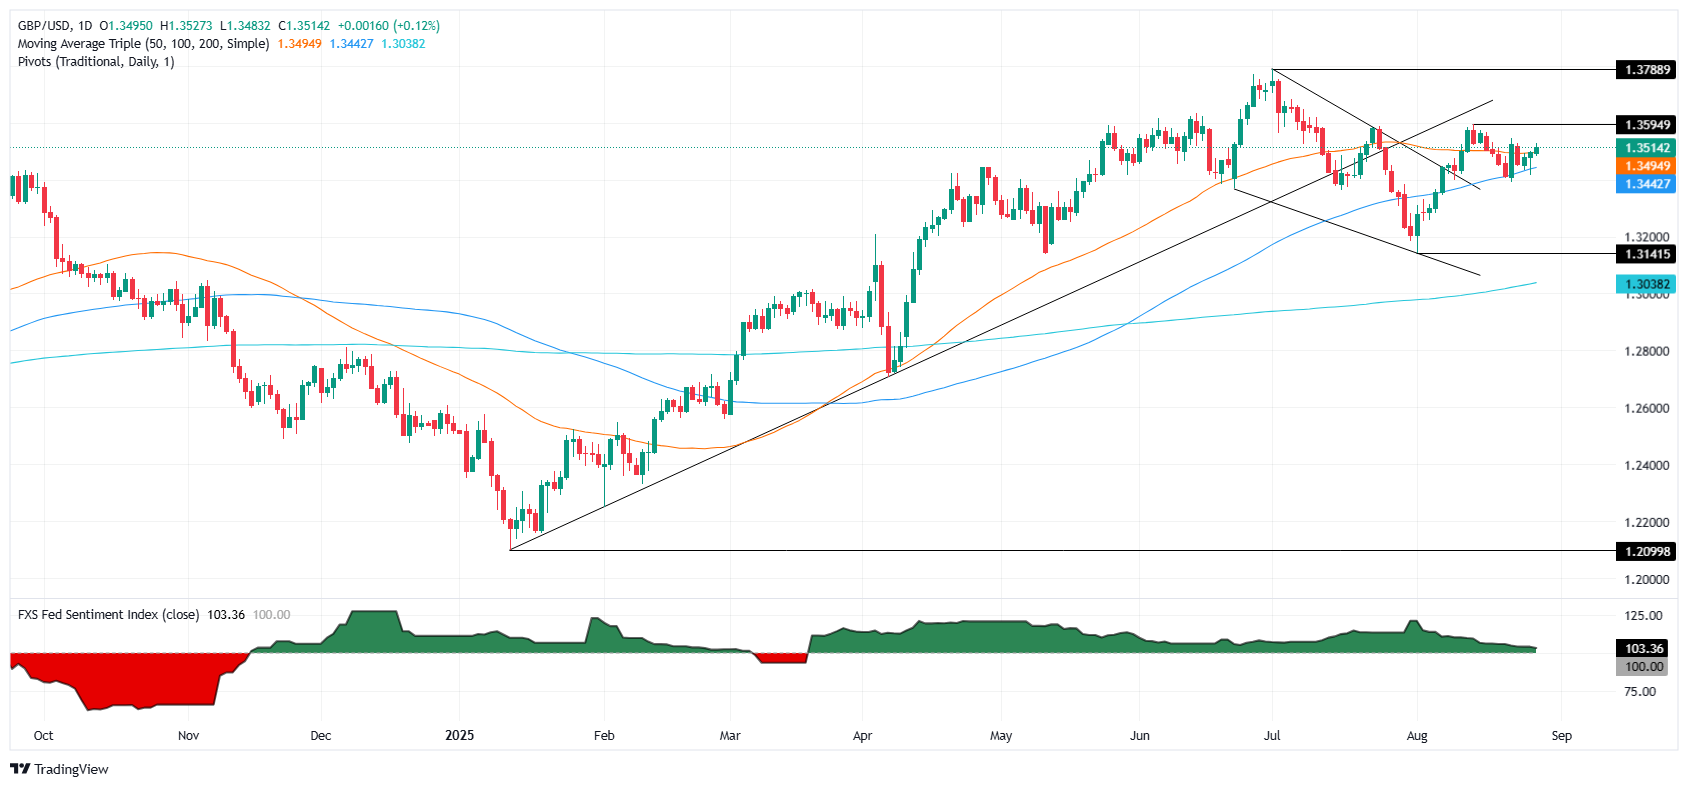
GBP/USD Price Forecast: Technical outlook
The GBP/USD extended its gains for three straight days, climbing above the 50-day Simple Moving Average (SMA)of 1.3494, which opened the door to reclaim 1.3500. A daily close above the latter will expose 1.3550 and the August 14 peak at 1.3594 ahead of 1.3600.
On the other hand, if the GBP/USD pair drops below 1.3500 and 1.3494, a move towards the 100-day SMA of 1.3442 is likely. On further weakness, 1.3400 is up next.
Pound Sterling Price This Month
The table below shows the percentage change of British Pound (GBP) against listed major currencies this month. British Pound was the strongest against the New Zealand Dollar.
| USD | EUR | GBP | JPY | CAD | AUD | NZD | CHF | |
|---|---|---|---|---|---|---|---|---|
| USD | -2.10% | -2.29% | -2.47% | -0.63% | -1.48% | 0.34% | -1.27% | |
| EUR | 2.10% | -0.10% | -0.34% | 1.57% | 0.76% | 2.35% | 0.91% | |
| GBP | 2.29% | 0.10% | -0.22% | 1.67% | 0.86% | 2.67% | 1.03% | |
| JPY | 2.47% | 0.34% | 0.22% | 1.86% | 1.00% | 2.75% | 1.21% | |
| CAD | 0.63% | -1.57% | -1.67% | -1.86% | -0.87% | 0.98% | -0.63% | |
| AUD | 1.48% | -0.76% | -0.86% | -1.00% | 0.87% | 1.79% | 0.28% | |
| NZD | -0.34% | -2.35% | -2.67% | -2.75% | -0.98% | -1.79% | -1.50% | |
| CHF | 1.27% | -0.91% | -1.03% | -1.21% | 0.63% | -0.28% | 1.50% |
The heat map shows percentage changes of major currencies against each other. The base currency is picked from the left column, while the quote currency is picked from the top row. For example, if you pick the British Pound from the left column and move along the horizontal line to the US Dollar, the percentage change displayed in the box will represent GBP (base)/USD (quote).
Recommended Articles


