


Oil looks set to advance towards $86 on increased geopolitical tensions
- WTI Oil finds support at $80.63 and jumps higher.
- Oil traders see demand possibly picking up and supply risks increasing due to geopolitical woes.
- The US Dollar Index trades above 104.00 though is a touch softer.
Oil prices are jumping higher on Monday after finding some technical support on the pivotal $80.63 level. Prices could be set to rise further due to both supply and demand factors. On the supply side, Russia faces issues from both sanctions and drone attacks from Ukraine on Russian refineries and storage facilities. On the demand side, the projection that the US Federal Reserve will cut three times this year, coupled with a decline in borrowing costs in Europe as well, could spur the global economy and thus demand for Oil.
The US Dollar, meanwhile, is retreating a touch from its last week’s rally. Although the Fed clearly communicated they will be cutting three times this year, markets appear not to be buying into the argumentation. This week, the Fed’s preferred inflation gauge – The Personal Consumption Expenditure (PCE) Price Index – is set to be released on Friday, and another pickup in inflation could mean mayhem in markets.
Crude Oil (WTI) trades at $81.04 per barrel, and Brent Oil trades at $85.29 per barrel at the time of writing.
Oil news and market movers: Russia getting crushed
- Markets are starting to gear up for possibly an extension of the 1 million barrel per day output cut from Saudi Arabia for the rest of the year to keep Oil afloat above $80.00.
- Bloomberg reports Iraq’s government and oil companies blamed each other for delays in resuming a key pipeline to Turkey, with discussion ongoing, that could keep the pipeline shut for longer.
- Goldman Sachs is bullish on commodities overall for this year as the US and Europe set to cut their interest rates.
- Indian refiners will no longer accept tankers owned by Russian state-run Sovcomflot PJSC because of the risk of sanctions.
Oil Technical Analysis: Up to OPEC to keep it above $80
Oil prices have found back their mojo, moving further away from the sub $70 levels seen earlier this year. Besides Russia being in the crosshairs, another big element is that markets are getting ready for another extension in production cuts from Saudi Arabia. With markets getting accustomed to the recent balance, a pickup in demand and another Saudi extension could be a perfect mix to push crude up to $90.
Oil bulls will see $86 appearing as the next cap. Further up, $86.90 follows suit before targeting $89.64 and $93.98 as top levels.
On the downside, both $80.00 and $80.60 should be acting as support now with the 200-day Simple Moving Average (SMA) as the level to catch any falling knives near $78.46. The 100-day and the 55-day SMA’s are near $75.54 and $76.79, respectively. Add the pivotal level near $75.27, and it looks like the downside is very limited and well-equipped to resist the selling pressure.
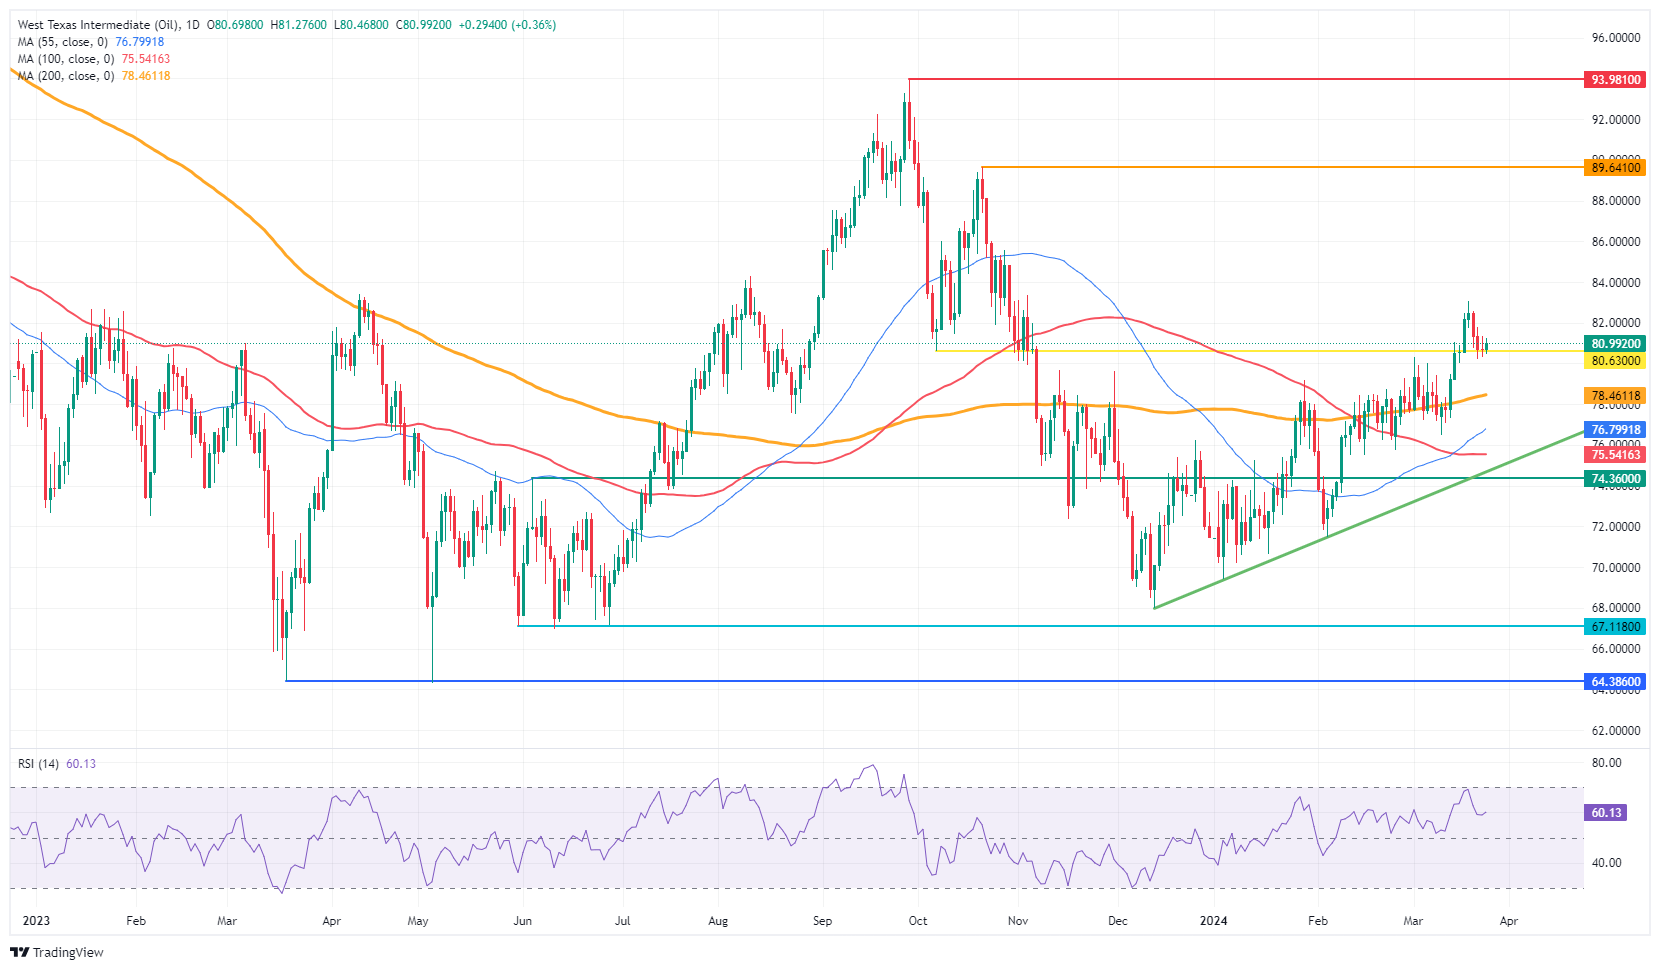
US WTI Crude Oil: Daily Chart
WTI Oil FAQs
WTI Oil is a type of Crude Oil sold on international markets. The WTI stands for West Texas Intermediate, one of three major types including Brent and Dubai Crude. WTI is also referred to as “light” and “sweet” because of its relatively low gravity and sulfur content respectively. It is considered a high quality Oil that is easily refined. It is sourced in the United States and distributed via the Cushing hub, which is considered “The Pipeline Crossroads of the World”. It is a benchmark for the Oil market and WTI price is frequently quoted in the media.
Like all assets, supply and demand are the key drivers of WTI Oil price. As such, global growth can be a driver of increased demand and vice versa for weak global growth. Political instability, wars, and sanctions can disrupt supply and impact prices. The decisions of OPEC, a group of major Oil-producing countries, is another key driver of price. The value of the US Dollar influences the price of WTI Crude Oil, since Oil is predominantly traded in US Dollars, thus a weaker US Dollar can make Oil more affordable and vice versa.
The weekly Oil inventory reports published by the American Petroleum Institute (API) and the Energy Information Agency (EIA) impact the price of WTI Oil. Changes in inventories reflect fluctuating supply and demand. If the data shows a drop in inventories it can indicate increased demand, pushing up Oil price. Higher inventories can reflect increased supply, pushing down prices. API’s report is published every Tuesday and EIA’s the day after. Their results are usually similar, falling within 1% of each other 75% of the time. The EIA data is considered more reliable, since it is a government agency.
OPEC (Organization of the Petroleum Exporting Countries) is a group of 13 Oil-producing nations who collectively decide production quotas for member countries at twice-yearly meetings. Their decisions often impact WTI Oil prices. When OPEC decides to lower quotas, it can tighten supply, pushing up Oil prices. When OPEC increases production, it has the opposite effect. OPEC+ refers to an expanded group that includes ten extra non-OPEC members, the most notable of which is Russia.
Recommended Articles


