

GBP/USD steadies near 1.2950 as traders digest PCE figures, tariff turmoil
- US Core PCE rises to 2.8%, reinforcing Fed's inflation concerns and limiting GBP/USD upside near 1.2967.
- UK Retail Sales beat forecasts, economy grows 0.1% in Q4 2024, boosts Sterling.
- Market focus now shifts to key US data: ISM PMI, JOLTs, and next week’s crucial Nonfarm Payrolls report.
The Pound Sterling remains firm, hovering around 1.2950 against the US Dollar, virtually unchanged, as traders digest the latest inflation report from the United States (US), amid uncertainty about a potential trade war escalation following Trump's imposition of tariffs on cars. At the time of writing, the GBP/USD exchange rate is 1.2948.
GBP/USD holds firm despite hotter Core PCE and mixed sentiment, as UK data outperforms and trade war fears loom
The Personal Consumption Expenditure (PCE) Price Index released by the US Bureau of Economic Analysis (BEA) remained unchanged at 2.5% YoY in February. The Core PCE print, sought by the Fed as its favorite inflation gauge, expanded 2.8% YoY, up from 2.7% for the same period. Although the prints maintained the status quo, inflation continues to drift away from the Fed’s 2% target.
Recently, the University of Michigan's Consumer Sentiment index deteriorated slightly, falling from 57.9 in the preliminary reading to 57.0. US households turned pessimistic, expecting prices to increase by 5% for a one-year period, while inflation expectations for five years ticked up from 3.9% to 4.1%. The survey said, “This month’s decline reflects a clear consensus across all demographic and political affiliations.”
Across the pond, UK Retail Sales in February dipped compared to January, but exceeded economists' estimates of -0.3%, rising by 1% MoM. Also, the economy grew 0.1% by the end of 2024, as revealed by the Office for National Statistics (ONS), as expected by analysts.
The data pushed the GBP/USD towards its daily peak of 1.2967, but it receded after investors digested US figures.
Next week, the UK economic docket remains absent. In the US, traders are focusing on April’s 2 Trump’s tariffs announcement, the ISM Manufacturing PMI for March, JOLTS Job Openings, and Nonfarm Payrolls.
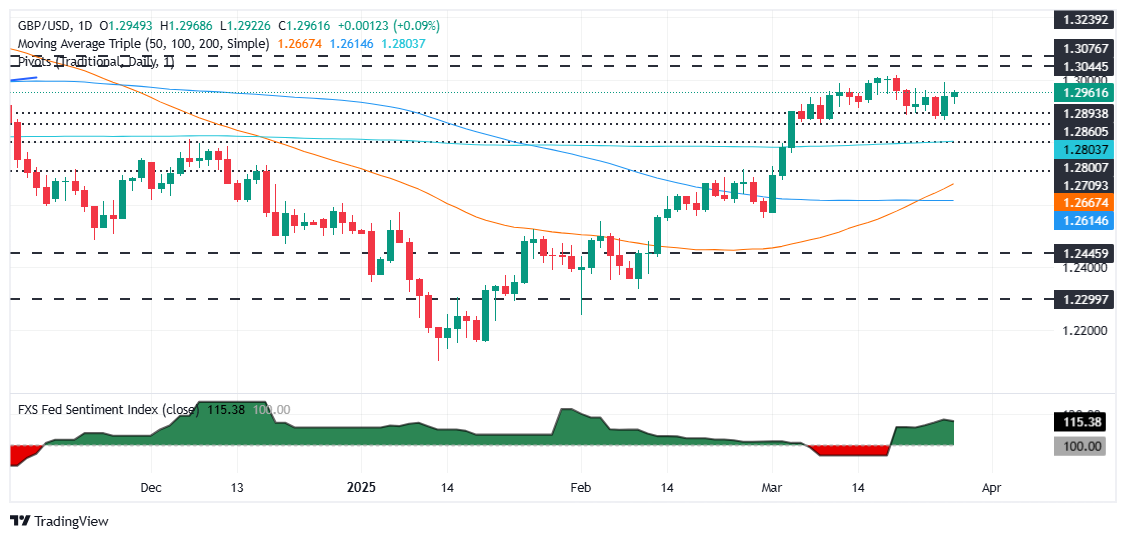
GBP/USD Price Forecast: Technical outlook
GBP/USD trades sideways with no apparent bias on Friday ahead of the weekend, yet a daily close near the 1.3000 figure could pave the way for further upside. This is because buyers kept the bears from pulling the exchange rate below 1.2900, keeping the pair from testing the 200-day Simple Moving Average (SMA) of 1.2802.
Despite this, bulls are not out of the woods. Although the Relative Strength Index (RSI) is bullish, shows they’re losing some steam, after retreating from overbought territory.
British Pound PRICE This week
The table below shows the percentage change of British Pound (GBP) against listed major currencies this week. British Pound was the strongest against the Japanese Yen.
| USD | EUR | GBP | JPY | CAD | AUD | NZD | CHF | |
|---|---|---|---|---|---|---|---|---|
| USD | -0.21% | -0.33% | 0.51% | -0.48% | -0.48% | 0.02% | -0.28% | |
| EUR | 0.21% | -0.23% | 0.20% | -0.22% | -0.30% | 0.29% | -0.02% | |
| GBP | 0.33% | 0.23% | 0.84% | -0.62% | -0.09% | 0.52% | 0.11% | |
| JPY | -0.51% | -0.20% | -0.84% | -0.98% | -1.01% | -0.46% | -0.79% | |
| CAD | 0.48% | 0.22% | 0.62% | 0.98% | 0.05% | 0.50% | 0.21% | |
| AUD | 0.48% | 0.30% | 0.09% | 1.01% | -0.05% | 0.58% | 0.28% | |
| NZD | -0.02% | -0.29% | -0.52% | 0.46% | -0.50% | -0.58% | -0.23% | |
| CHF | 0.28% | 0.02% | -0.11% | 0.79% | -0.21% | -0.28% | 0.23% |
The heat map shows percentage changes of major currencies against each other. The base currency is picked from the left column, while the quote currency is picked from the top row. For example, if you pick the British Pound from the left column and move along the horizontal line to the US Dollar, the percentage change displayed in the box will represent GBP (base)/USD (quote).
Recommended Articles


