AUD/JPY Price Analysis: Bears take control but pair holds above 92.00

Source Fxstreet
  • AUD/JPY was seen trading around the 92.80 zone ahead of the Asian session, pulling back after two consecutive days of gains.
  • Despite the decline, the pair remains above the 92.00 threshold, with technical indicators still in negative territory.
  • Sideways trading could persist above 92.00 as the market awaits fresh momentum, with resistance at 93.50 and support at 92.00.

AUD/JPY fell on Thursday ahead of the Asian session, reversing some of the gains from earlier in the week. The pair dropped toward the 92.80 area, reflecting renewed bearish momentum after a brief period of buying pressure. While sellers regained control, the pair remains above the key 92.00 threshold, suggesting that a period of consolidation might be ahead.

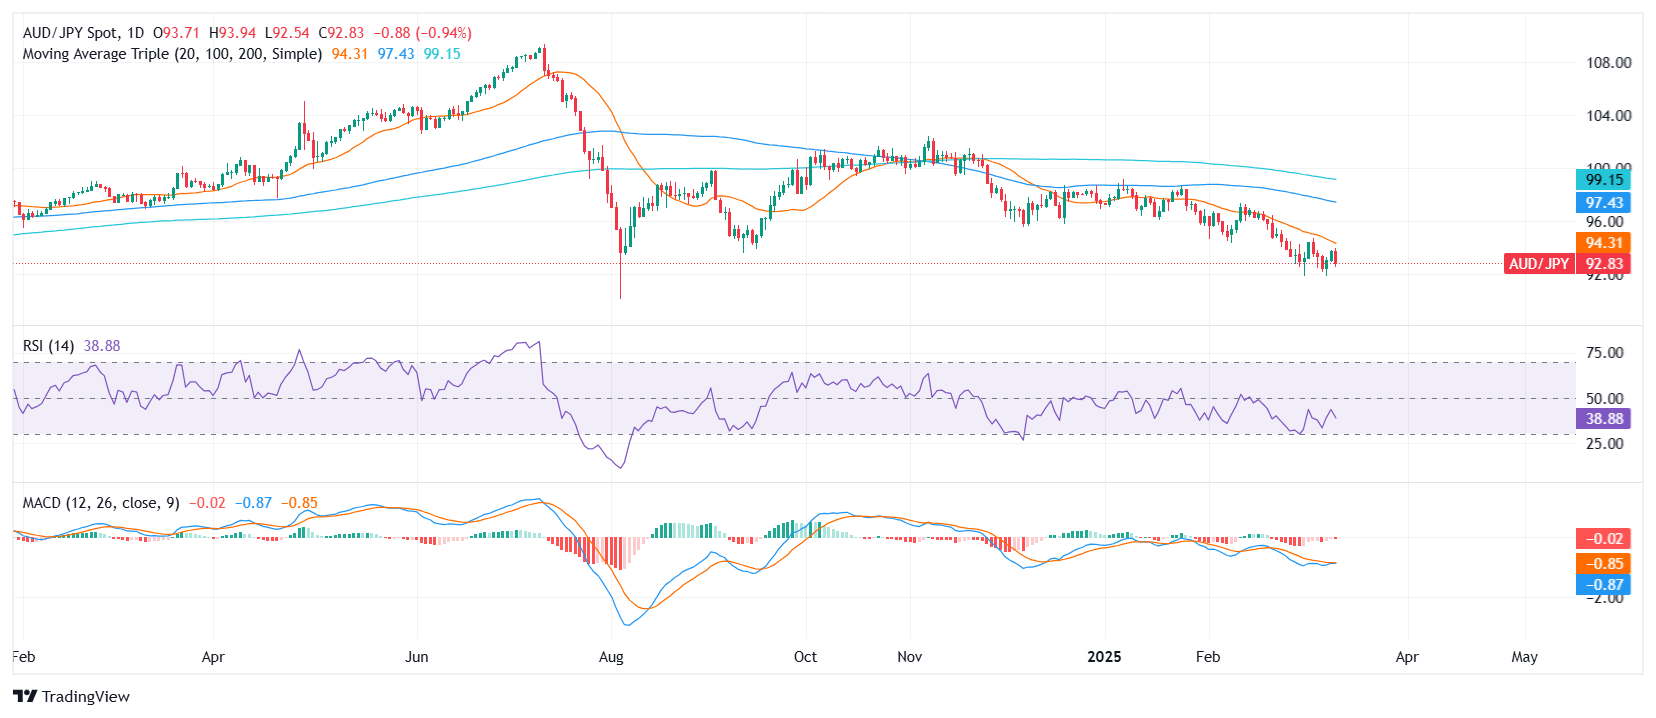
Looking at technical indicators, the Relative Strength Index (RSI) is declining sharply within the negative zone, indicating weakening bullish strength. Meanwhile, the Moving Average Convergence Divergence (MACD) is printing decreasing red bars, reinforcing the view that downside pressure persists. However, the pair still trades within a broader range, limiting immediate downside risks.

For now, support remains firm at 92.00, a level that has provided a strong floor in recent sessions. A break below could accelerate bearish momentum toward 91.50. On the upside, resistance is seen around 93.50, where sellers have consistently stepped in. If AUD/JPY remains above 92.00, the pair could trade sideways in the near term before finding a clearer directional bias.

AUD/JPY daily chart

Disclaimer: For information purposes only. Past performance is not indicative of future results.
placeholder
Bitcoin Price Forecast: BTC battles at key technical zone amid mixed flow signalsBitcoin (BTC) steadies around the key technical support on Tuesday after its recent correction. The Crypto King’s next directional move could hinge on this key technical zone.
Author  FXStreet
9 hours ago
Bitcoin (BTC) steadies around the key technical support on Tuesday after its recent correction. The Crypto King’s next directional move could hinge on this key technical zone.
placeholder
WTI declines below $102.00 after Trump says he called off Iran attacksWest Texas Intermediate (WTI), the US crude oil benchmark, is trading around $101.85 during the early Asian trading hours on Tuesday. The WTI price declines after US President Donald Trump said he was holding off a military attack on Iran planned for Tuesday at the request of Gulf states.
Author  FXStreet
18 hours ago
West Texas Intermediate (WTI), the US crude oil benchmark, is trading around $101.85 during the early Asian trading hours on Tuesday. The WTI price declines after US President Donald Trump said he was holding off a military attack on Iran planned for Tuesday at the request of Gulf states.
placeholder
Iran Situation Rekindles Threat of War. Bitcoin Price Decline Accelerates, $75,000 Geopolitical Defense Line Faces TestU.S.-Israel discussions on resuming strikes against Iran trigger an accelerated Bitcoin price pullback; future gains depend on whether the $75,000 support level holds.On May 18, the poten
Author  TradingKey
Yesterday 09: 03
U.S.-Israel discussions on resuming strikes against Iran trigger an accelerated Bitcoin price pullback; future gains depend on whether the $75,000 support level holds.On May 18, the poten
placeholder
Euro softens to near 1.1600 on US–Iran tensions The EUR/USD pair trades in negative territory around 1.1615 during the early Asian session on Monday. The Euro (EUR) extends the decline as the prolonged US-Iran conflict weighs on the riskier assets.
Author  FXStreet
Yesterday 01: 34
The EUR/USD pair trades in negative territory around 1.1615 during the early Asian session on Monday. The Euro (EUR) extends the decline as the prolonged US-Iran conflict weighs on the riskier assets.
placeholder
Financial Markets 2026: Volatility Catalysts in Gold, Silver, Oil, and Blue-Chip Stocks—A CFD Trader's OutlookGet a comprehensive financial market 2026 outlook exploring key economic drivers, volatility catalysts in gold, oil and stocks, and what the evolving economic outlook means for cfd trading strategies and risk management on global markets.
Author  Rachel Weiss
May 15, Fri
Get a comprehensive financial market 2026 outlook exploring key economic drivers, volatility catalysts in gold, oil and stocks, and what the evolving economic outlook means for cfd trading strategies and risk management on global markets.
Related Instrument
goTop
quote