NZD/USD Price Analysis: brief pullback questions 20-day SMA support

Source Fxstreet
  • NZD/USD fell at the end of the weekresting around 0.5590 after struggling to sustain previous gains.
  • RSI plunges to 40 in negative territory, pointing to weakening momentum as sellers regain confidence.
  • MACD histogram shows rising green bars, hinting that not all bullish interest has faded despite the drop.

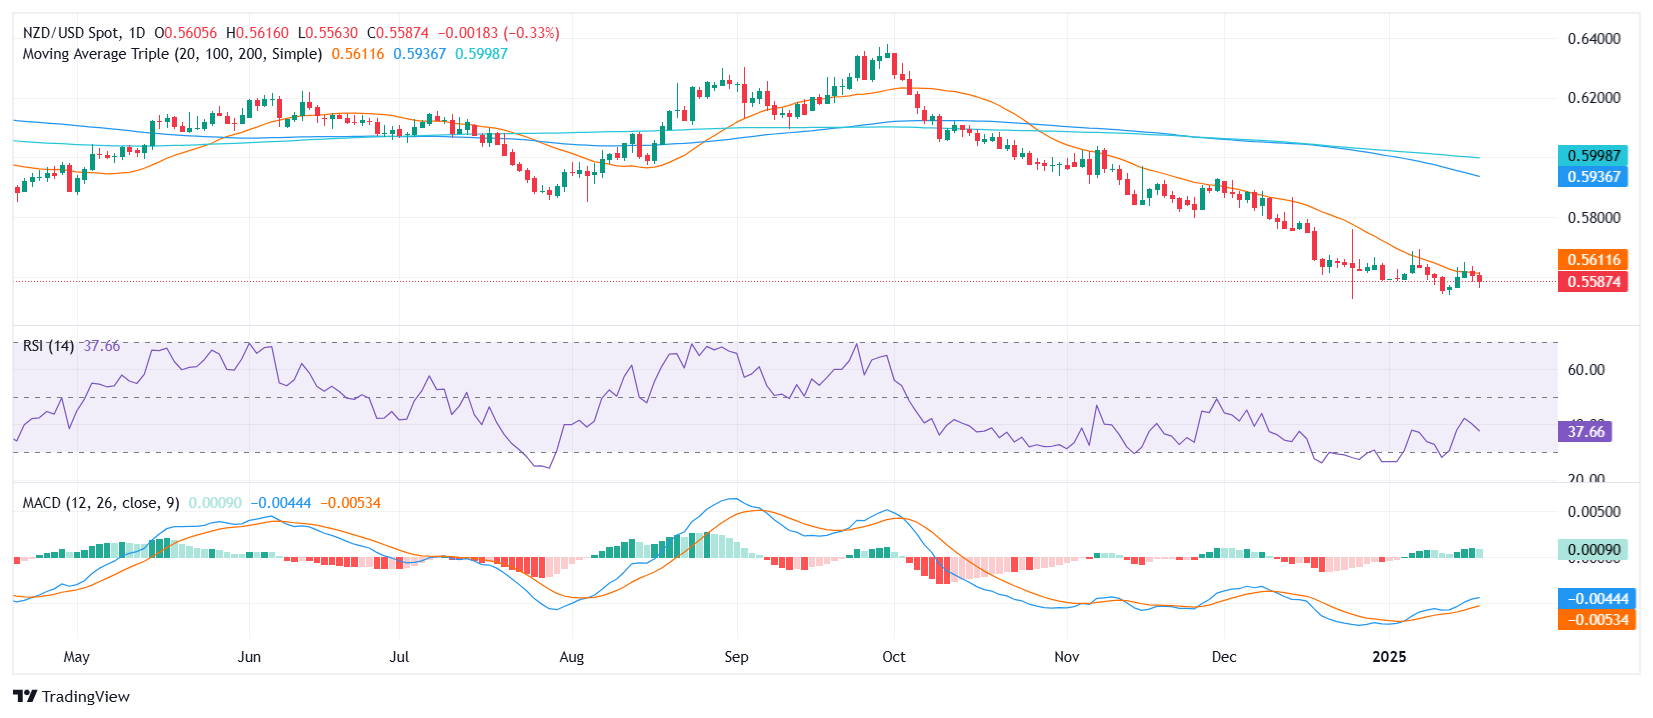
The NZD/USD pair lost ground on Friday, sliding 0.30% to settle near 0.5590. This downturn casts doubt on the sustainability of the pair’s recent consolidation above its 20-day Simple Moving Average (SMA), a region that might still offer a line of defense for buyers hoping to maintain upward traction. With sellers beginning to chip away at gains seen earlier in the week, it remains uncertain whether the pair can cling to its fragile support zone.

From a technical perspective, momentum readings are mixed. The Relative Strength Index (RSI) has retreated sharply to 40, underscoring a renewed bout of bearish pressure. Meanwhile, the Moving Average Convergence Divergence (MACD) histogram continues to produce green bars, suggesting that some underlying bullish sentiment persists but in a less confident manner. These conflicting signals underscore the delicate nature of the current price action.

Should NZD/USD consolidate effectively near the 20-day SMA, now around the 0.5600 mark, buyers may attempt another push higher, with 0.5630 serving as an interim hurdle before a potential run at 0.5650. Conversely, a decisive breach below 0.5580 would likely hand control back to the bears, exposing lower targets near the 0.5550 region and undermining the pair’s nascent support base.

NZD/USD daily chart
Disclaimer: For information purposes only. Past performance is not indicative of future results.
placeholder
Natural Gas sinks to pivotal level as China’s demand slumpsNatural Gas price (XNG/USD) edges lower and sinks to $2.56 on Monday, extending its losing streak for the fifth day in a row. The move comes on the back of China cutting its Liquified Natural Gas (LNG) imports after prices rose above $3.0 in June. It
Author  FXStreet
Jul 01, 2024
Natural Gas price (XNG/USD) edges lower and sinks to $2.56 on Monday, extending its losing streak for the fifth day in a row. The move comes on the back of China cutting its Liquified Natural Gas (LNG) imports after prices rose above $3.0 in June. It
placeholder
Bitcoin ETF Inflows For 2025 Now Outpace 2024, Data ShowsUS Bitcoin spot exchange-traded funds (ETFs) have seen more inflows this year so far compared to the same point in 2024, according to data.
Author  Bitcoinist
Jul 16, Wed
US Bitcoin spot exchange-traded funds (ETFs) have seen more inflows this year so far compared to the same point in 2024, according to data.
placeholder
Gold Price Forecast: XAU/USD gains momentum to near $3,650, eyes on US CPI releaseThe Gold price (XAU/USD) gains momentum to near $3,645 during the early Asian session on Thursday.
Author  FXStreet
Sep 11, Thu
The Gold price (XAU/USD) gains momentum to near $3,645 during the early Asian session on Thursday.
placeholder
Silver price moves above $47.50 as safe-haven demand increasesSilver price (XAG/USD) halts its three-day losing streak, trading around $47.60 per troy ounce during the Asian hours on Wednesday.
Author  FXStreet
Yesterday 07: 04
Silver price (XAG/USD) halts its three-day losing streak, trading around $47.60 per troy ounce during the Asian hours on Wednesday.
placeholder
Dogecoin Price Forecast: DOGE steadies amid declining retail interest, bearish on-chain signalsBoth the on-chain and derivatives data suggest weak sentiment among retail and long-term holders.
Author  FXStreet
Yesterday 09: 39
Both the on-chain and derivatives data suggest weak sentiment among retail and long-term holders.
Related Instrument
goTop
quote