NZD/JPY Price Analysis: Pair retreats to 87.50 as losses resume

Source Fxstreet
  • NZD/JPY fell to 87.48 on Friday, extending its weekly losses.
  • Indicators are dangerously close to oversold conditions, signaling a potential correction.
  • Bearish momentum remains intact, with risks of further downside.

The NZD/JPY pair extended its decline on Friday, falling to 87.48 as selling pressure intensified. This marks a continuation of the bearish trend that began earlier in the week, with the pair breaking below key support levels and showing no signs of recovery.

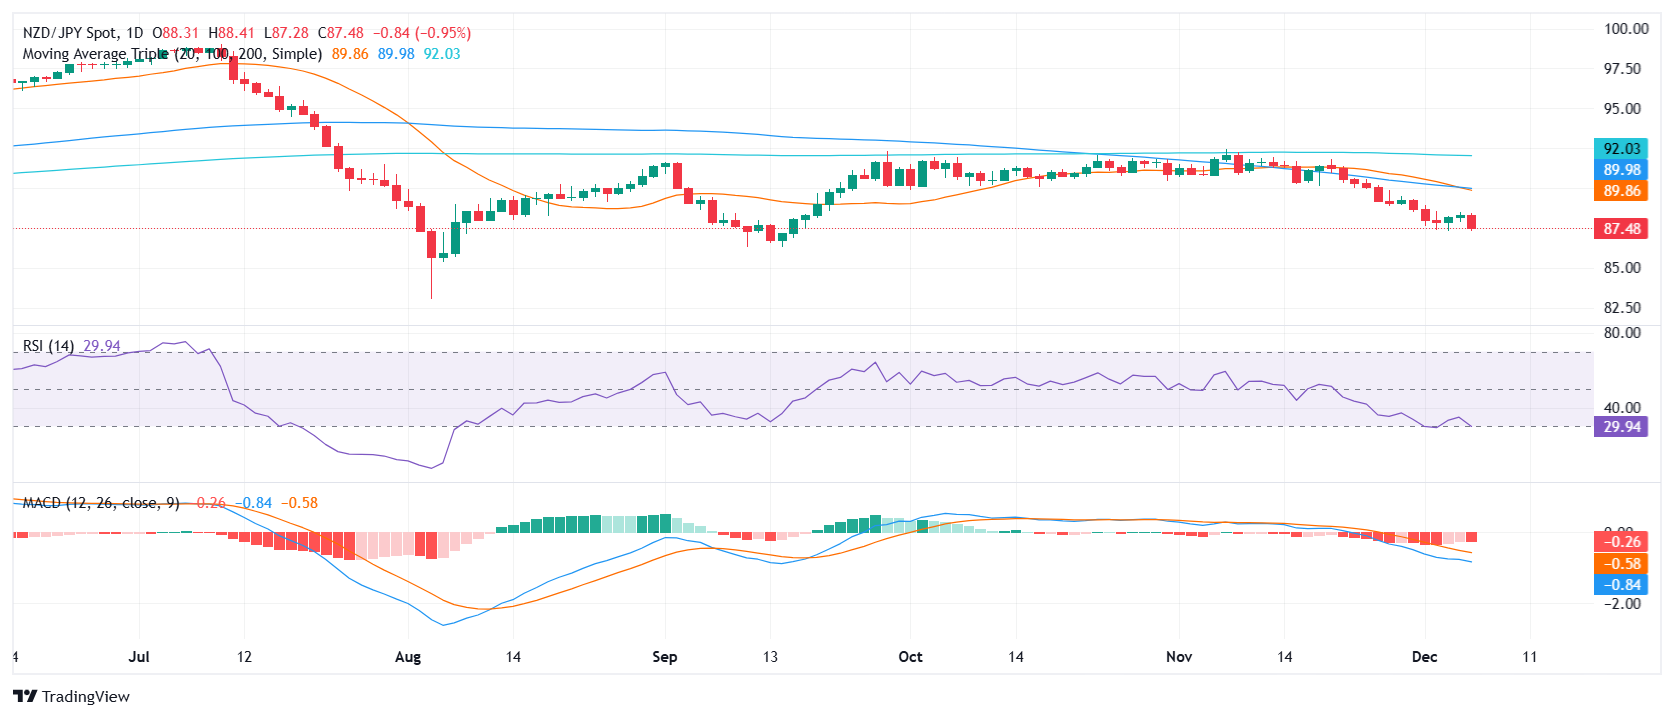
Technical indicators highlight the bearish outlook. The Relative Strength Index (RSI) is now approaching oversold territory, reflecting sustained selling pressure and suggesting that a potential correction may be on the horizon. Similarly, the Moving Average Convergence Divergence (MACD) indicator shows persistent bearish momentum, with steady red bars further reinforcing the downside risks.

For the bulls to regain control, a move back above the 88.00 level would be crucial, followed by a test of the 89.00 area. However, until a reversal is confirmed, the pair remains at risk of further declines, with immediate targets in the 85.00-86.00 range.

NZD/JPY daily chart

Disclaimer: For information purposes only. Past performance is not indicative of future results.
placeholder
$180 Oil Prices Imminent? Saudi Arabia Warns: Crisis to Last Until Late April, Oil Prices Will Break Historic HighsThe continuous escalation of geopolitical conflicts in the Middle East is pushing global energy markets toward their most severe test in nearly 20 years.The Wall Street Journal reports th
Author  TradingKey
Mar 20, Fri
The continuous escalation of geopolitical conflicts in the Middle East is pushing global energy markets toward their most severe test in nearly 20 years.The Wall Street Journal reports th
placeholder
Gold tumbles below $4,650 as inflation fears and liquidity squeeze weighGold price (XAU/USD) remains under selling pressure near $4,640 during the early Asian session on Friday. The precious metal extends the decline as soaring crude oil and energy prices, driven by the escalating US-Israeli war with Iran, reignite inflation fears.
Author  FXStreet
Mar 20, Fri
Gold price (XAU/USD) remains under selling pressure near $4,640 during the early Asian session on Friday. The precious metal extends the decline as soaring crude oil and energy prices, driven by the escalating US-Israeli war with Iran, reignite inflation fears.
placeholder
Bitcoin Drops Below $70,000 as Crypto Rally Fails to MaterializeThe crypto market experienced a significant pullback, Bitcoin (BTCUSD) fell below the key $70,000 mark during intraday trading, triggering short-term stop-loss orders and causing market s
Author  TradingKey
Mar 19, Thu
The crypto market experienced a significant pullback, Bitcoin (BTCUSD) fell below the key $70,000 mark during intraday trading, triggering short-term stop-loss orders and causing market s
placeholder
Gold falls below $4,850 as Fed holds rates steadyGold price (XAU/USD) faces some selling pressure near $4,830 during the early Asian session on Thursday.
Author  FXStreet
Mar 19, Thu
Gold price (XAU/USD) faces some selling pressure near $4,830 during the early Asian session on Thursday.
placeholder
WTI Crude Prices Capped at $100, Has the Rally Ended? How to Trade the Short Term? Today (March 18), WTI crude oil continued to exhibit significant short-term volatility, driven by a tug-of-war between headlines and data. Intraday, prices retreated from Tuesday's high o
Author  TradingKey
Mar 18, Wed
Today (March 18), WTI crude oil continued to exhibit significant short-term volatility, driven by a tug-of-war between headlines and data. Intraday, prices retreated from Tuesday's high o
Related Instrument
goTop
quote