NZD/USD Price Analysis: Pair plunges to 0.5830 after rejection at 20-day SMA

Source Fxstreet
  • NZD/USD drops sharply on Friday, settling around 0.5830.
  • Pair faces strong resistance at the 20-day SMA, which remains unbroken.
  • Indicators show weakening buying traction, reinforcing the bearish outlook.

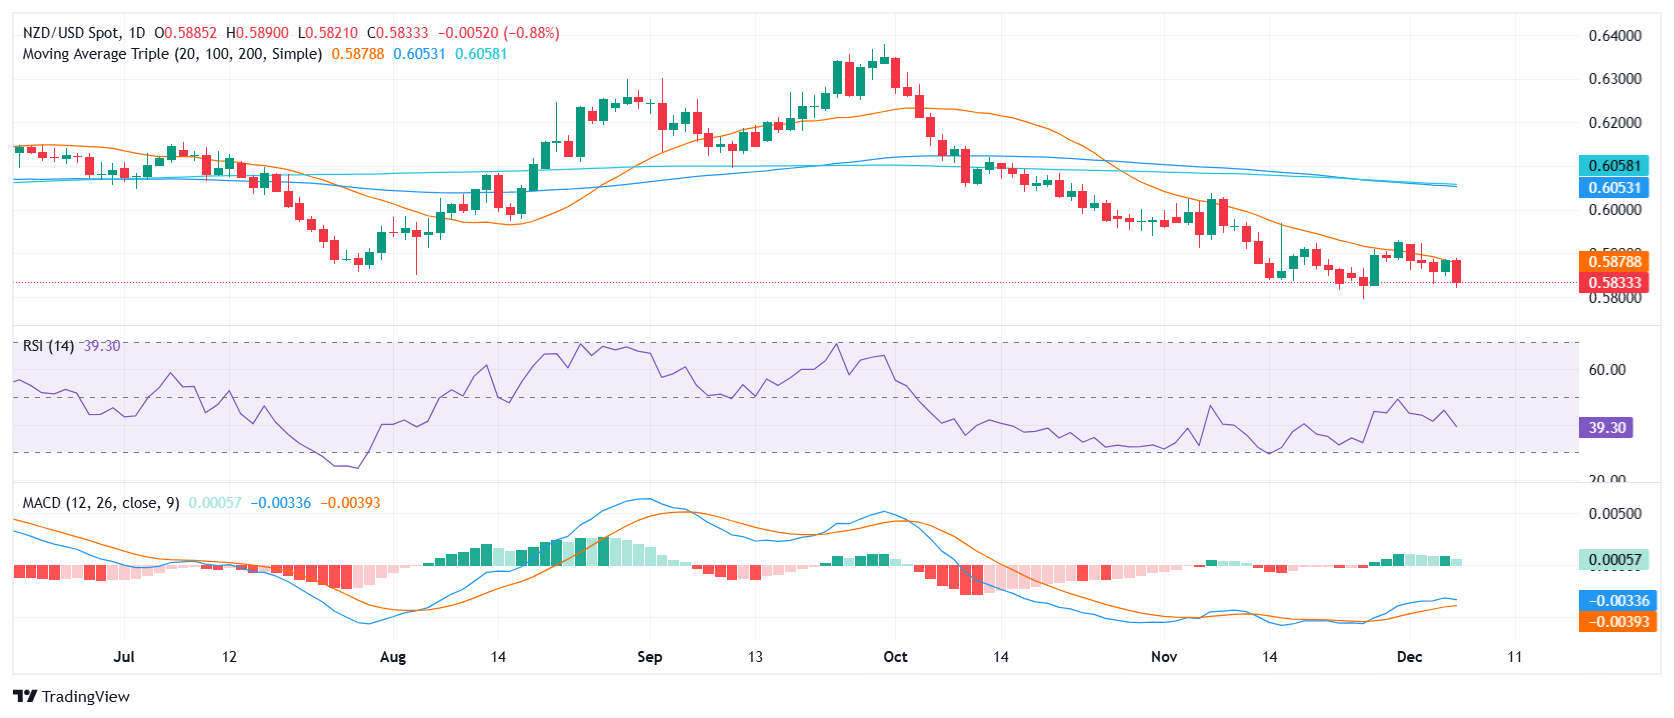
The NZD/USD pair extended its decline on Friday, plunging to 0.5830 after failing to break above the 20-day Simple Moving Average (SMA). This key technical level continues to act as a formidable resistance, preventing a bullish recovery and leaving the pair under significant selling pressure.

Technical indicators reflect the loss of bullish momentum. The Relative Strength Index (RSI) shows a falling trajectory, staying in negative territory, signaling weakening buying traction. Meanwhile, the Moving Average Convergence Divergence (MACD) displays a shrinking histogram with fading green bars, indicating a slowdown in bullish momentum and reinforcing the bearish sentiment.

For now, the outlook remains decidedly bearish, with the 20-day SMA serving as a critical barrier for any upside attempts. Should the selling pressure persist, the pair may target further declines towards the 0.5800 psychological level. On the upside, a decisive break above the 20-day SMA, currently near 0.5880, is necessary to shift momentum in favor of the bulls.

NZD/USD daily chart
Disclaimer: For information purposes only. Past performance is not indicative of future results.
placeholder
U.S. September Nonfarm Payrolls: Two-Scenario Analysis, Will U.S. Stocks Diverge in Short-Term and Medium-to-Long-Term Trends?1. IntroductionAffected by the U.S. government shutdown, the September nonfarm payrolls report—originally scheduled for release in early October—will be officially published on 20 November. As a key "
Author  TradingKey
5 hours ago
1. IntroductionAffected by the U.S. government shutdown, the September nonfarm payrolls report—originally scheduled for release in early October—will be officially published on 20 November. As a key "
placeholder
Ethereum Dips Below $3,000: Is the Bull Market at an End?Ethereum's price plunged below $3,000 for the first time in four months, marking growing concerns of a potential end to the bull market.
Author  Mitrade
12 hours ago
Ethereum's price plunged below $3,000 for the first time in four months, marking growing concerns of a potential end to the bull market.
placeholder
Ethereum Edges Toward Long-Term Holders’ Cost Basis, Now Only 8% Above Key Accumulation LevelEthereum is trading near $3,150 and just 8% above a key $2,895 long-term holders’ cost basis, with on-chain flows, macro uncertainty and support around $3,000–$2,800 all shaping what comes next for ETH.
Author  Mitrade
13 hours ago
Ethereum is trading near $3,150 and just 8% above a key $2,895 long-term holders’ cost basis, with on-chain flows, macro uncertainty and support around $3,000–$2,800 all shaping what comes next for ETH.
placeholder
Gold Price Forecast: XAU/USD declines below $4,050 on USD strength and hawkish Fed comments Gold price (XAU/USD) extends the decline to around $4,030 during the early Asian session on Tuesday. The precious metal edges lower as traders dialed back expectations of a US interest rate cut next month.
Author  FXStreet
14 hours ago
Gold price (XAU/USD) extends the decline to around $4,030 during the early Asian session on Tuesday. The precious metal edges lower as traders dialed back expectations of a US interest rate cut next month.
placeholder
Bitcoin's 2025 Gains Erased: Who Ended the BTC Bull Market?After slumping below $93,500, 2025 Bitcoin price gains have been completely wiped out. Investors are puzzled as to why its bull market, underpinned by political tailwinds, institutionaliz
Author  TradingKey
Yesterday 10: 36
After slumping below $93,500, 2025 Bitcoin price gains have been completely wiped out. Investors are puzzled as to why its bull market, underpinned by political tailwinds, institutionaliz
goTop
quote