


Canadian Dollar tumbles post-NFP
- The Canadian Dollar tumbled nearly nine-tenths of a percent on Friday.
- Canada added more jobs than expected, but the Unemployment Rate lurched higher.
- US NFP numbers also beat the street, but sticky wages keep inflation concerns elevated.
The Canadian Dollar (CAD) tumbled into recent lows on Friday, getting pummeled back into the bottom end after mixed datapoints in both the US and Canada pushed investors back into a cautious stance. Both countries saw higher-than-expected job additions in November, but unemployment rates on both sides of the border ticked higher on a monthly basis as well.
Canada added nearly twice as many jobs as expected in November, setting a seven-month high on monthly job growth. However, the Canadian Unemployment Rate accelerated to its highest level in over three years, shattering investor confidence in the Loonie to wrap up the trading week. Coupled with a broad-market tilt back into the safety of the Greenback after November’s US Nonfarm Payrolls (NFP) report, traders pushed USD/CAD back into its highest bids in almost five years. The pair is poised for its highest daily close since May of 2020.
Daily digest market movers: Canadian Dollar tumbles as Canadian Unemployment Rate soars
- The Canadian Dollar nearly a full percent on Friday, while the Greenback rallied across the board, pushing USD/CAD north of 1.4150.
- Canada added 50.5K net new jobs in November, well above the 25K forecast and climbing even further from October’s 14.5K print.
- Despite the upswing in new jobs, the Canadian Unemployment Rate lurched to 6.8% versus the 6.6% forecast and 6.5% last.
- Canadian Average Hourly Wages also declined sharply, falling to 3.9% YoY from the previous period’s 4.9%.
- US NFP rebounded firmly in November, rising by 227K versus the forecast 220K, recovering from October’s revised 36K.
- The US Unemployment Rate also rose to 4.2% as expected in November, ticking up from the previous month’s 4.1%.
Canadian Dollar price forecast
Friday’s Loonie plunge and comparative Greenback surge has bootstrapped USD/CAD into its highest daily close since May of 2020, bolstering bids into chart territory above 1.4150. A recent upswing into the same region failed to generate a bullish close above near-term consolidative highs, implying CAD short positions have successfully pushed into fresh territory in a meaningful way to round out an otherwise unremarkable trading week.
USD/CAD is now up around 7% for the year, rising 1.1% in December alone. If current market dynamics keep bids on the high side, the pair will be poised to close in the green for a fourth straight month.
USD/CAD daily chart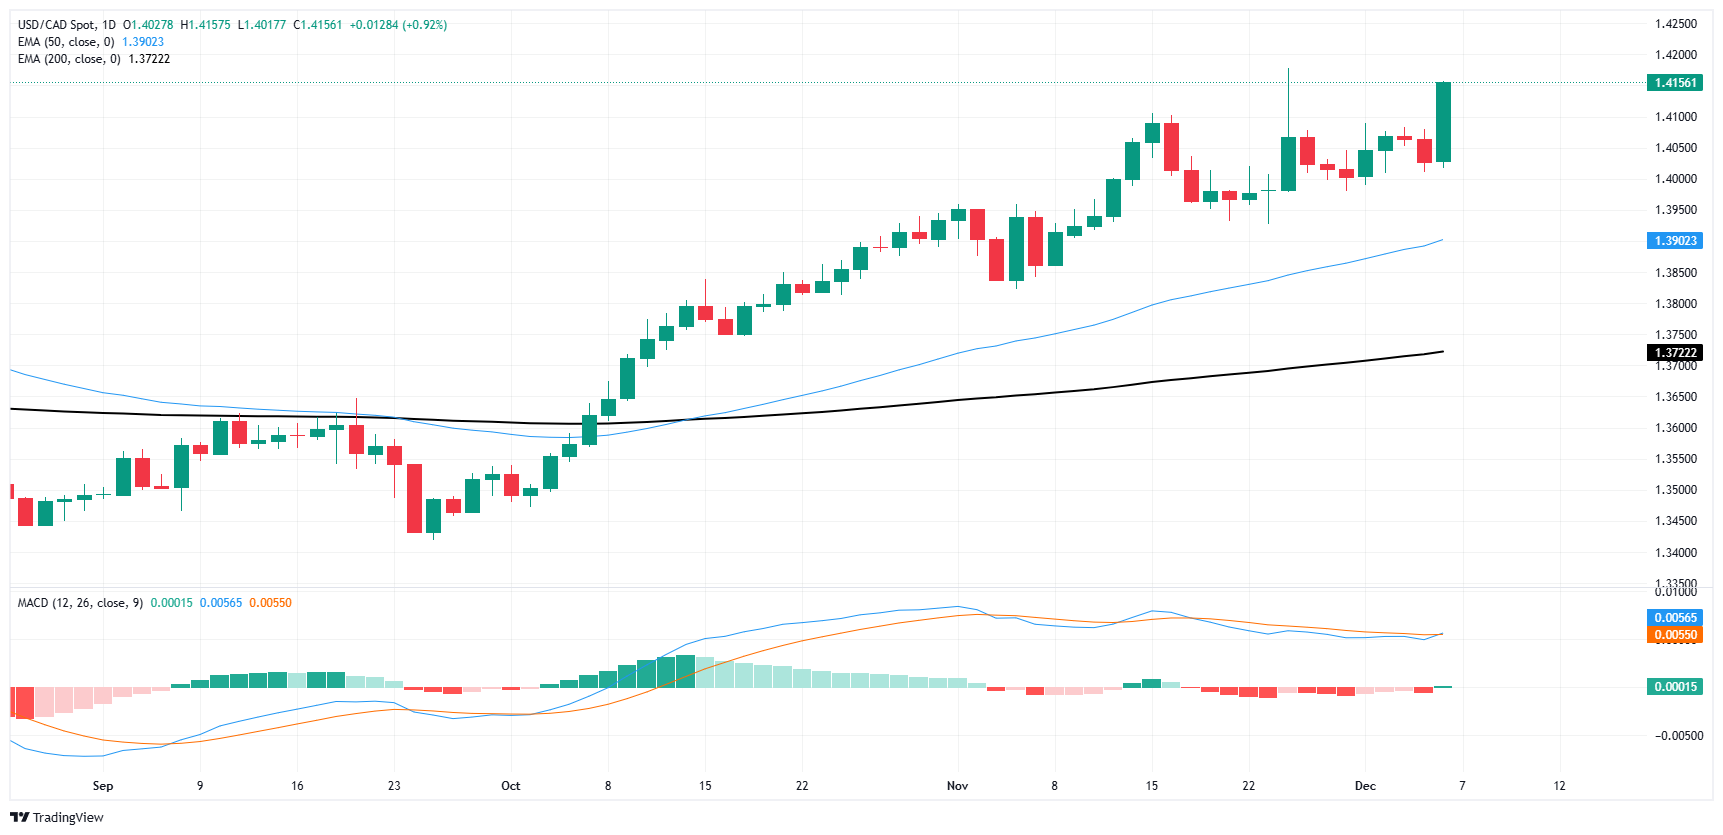
Canadian Dollar FAQs
The key factors driving the Canadian Dollar (CAD) are the level of interest rates set by the Bank of Canada (BoC), the price of Oil, Canada’s largest export, the health of its economy, inflation and the Trade Balance, which is the difference between the value of Canada’s exports versus its imports. Other factors include market sentiment – whether investors are taking on more risky assets (risk-on) or seeking safe-havens (risk-off) – with risk-on being CAD-positive. As its largest trading partner, the health of the US economy is also a key factor influencing the Canadian Dollar.
The Bank of Canada (BoC) has a significant influence on the Canadian Dollar by setting the level of interest rates that banks can lend to one another. This influences the level of interest rates for everyone. The main goal of the BoC is to maintain inflation at 1-3% by adjusting interest rates up or down. Relatively higher interest rates tend to be positive for the CAD. The Bank of Canada can also use quantitative easing and tightening to influence credit conditions, with the former CAD-negative and the latter CAD-positive.
The price of Oil is a key factor impacting the value of the Canadian Dollar. Petroleum is Canada’s biggest export, so Oil price tends to have an immediate impact on the CAD value. Generally, if Oil price rises CAD also goes up, as aggregate demand for the currency increases. The opposite is the case if the price of Oil falls. Higher Oil prices also tend to result in a greater likelihood of a positive Trade Balance, which is also supportive of the CAD.
While inflation had always traditionally been thought of as a negative factor for a currency since it lowers the value of money, the opposite has actually been the case in modern times with the relaxation of cross-border capital controls. Higher inflation tends to lead central banks to put up interest rates which attracts more capital inflows from global investors seeking a lucrative place to keep their money. This increases demand for the local currency, which in Canada’s case is the Canadian Dollar.
Macroeconomic data releases gauge the health of the economy and can have an impact on the Canadian Dollar. Indicators such as GDP, Manufacturing and Services PMIs, employment, and consumer sentiment surveys can all influence the direction of the CAD. A strong economy is good for the Canadian Dollar. Not only does it attract more foreign investment but it may encourage the Bank of Canada to put up interest rates, leading to a stronger currency. If economic data is weak, however, the CAD is likely to fall.
Recommended Articles


