AUD/JPY Price Analysis: Bulls defend the 20-day SMA, bears are around the corner

Source Fxstreet
  • AUD/JPY currently facing minor losses, standing strong at 97.45 after hitting a low of 96.85.
  • The cross faced losses following the release of weak Australian Retail Sales figures from December.
  • Bulls display resilience but the bears are slowly building momentum.

In Tuesday's session, the AUD/JPY pair was observed at the 97.45 level, recording mild losses but recovering from a low of 96.85 as the Aussie weakened following the release of soft Retail Sales figures. The broader outlook on the daily chart showcased bullish dominance, with the bulls determinedly holding their ground. Meanwhile, the four-hour chart indicated a rapid recovery by the buyers, reaffirming the prevalent bullish sentiment.

Weak December Retail Sales underscore sluggish Australian economic momentum, but markets still only discount a 10% chance of a 25 bps rate cut from the Reserve Bank of Australia (RBA) in February. Meanwhile, mixed labor market figures in Japan including falling unemployment rate and job-to-applicant ratio, gives little impetus for Bank of Japan (BoJ) to rush in pivoting its monetary policy, with market expectations suggesting a June liftoff.

AUD/JPY levels to watch

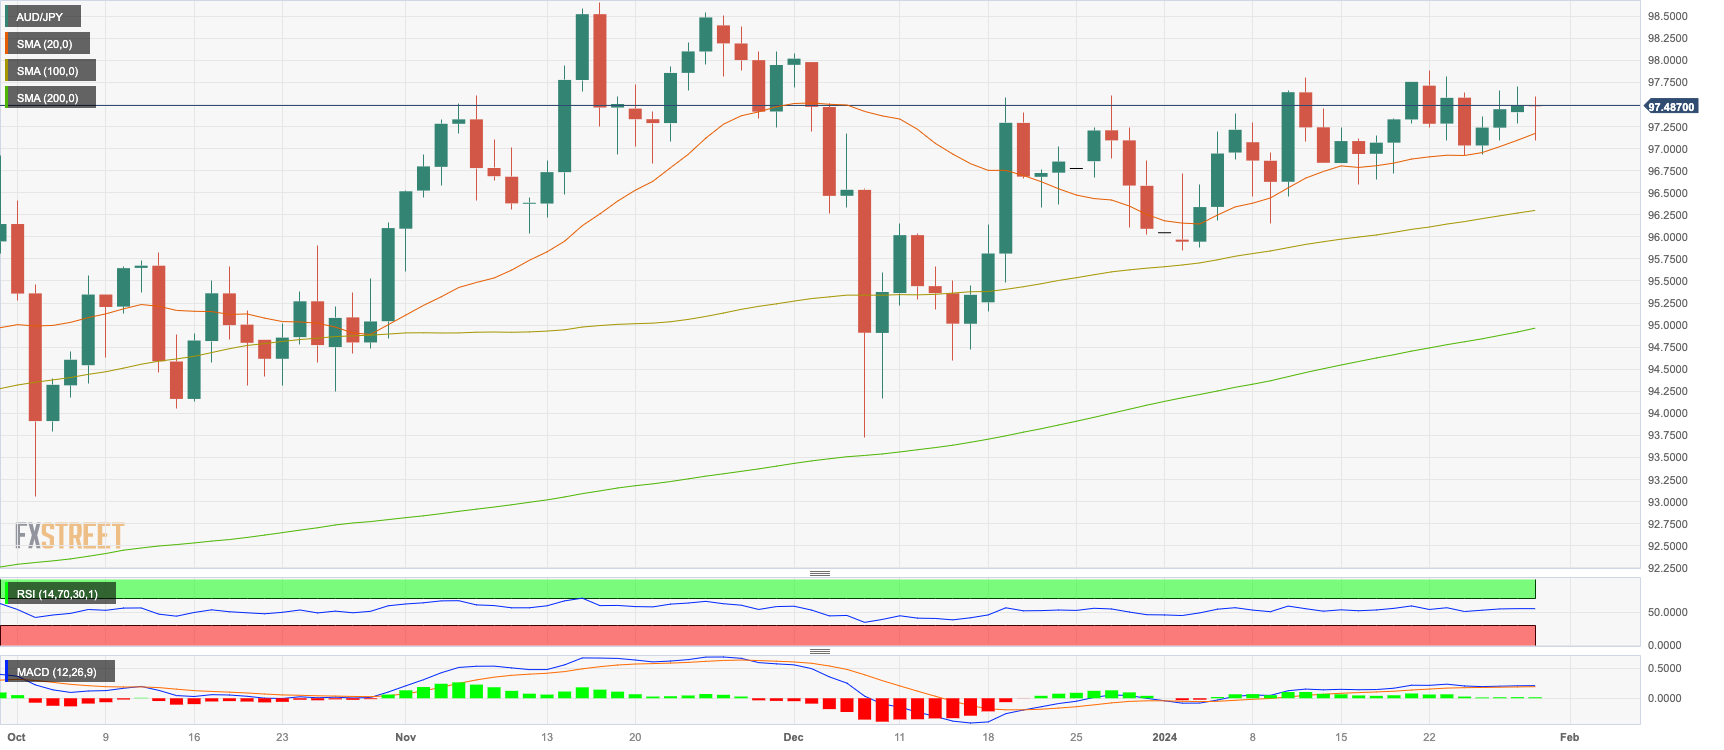
The indicators on the daily chart are indicating a subtle power of the bulls over the bears. The Relative Strength Index (RSI) is displaying neutrality, situated comfortably in a positive zone. The Moving Average Convergence Divergence (MACD) mirrors this sentiment, with green bars that remain static, neither rising nor falling. That being said, the market sentiment leans slightly in favor of the bulls due to the crosses's position against the Simple Moving Averages (SMAs). Hovering above the 20, 100, and 200-day SMAs, the AUD/JPY displays signs of bullish dominance on a grander scale.

AUD/JPY daily chart

Disclaimer: For information purposes only. Past performance is not indicative of future results.
placeholder
Natural Gas sinks to pivotal level as China’s demand slumpsNatural Gas price (XNG/USD) edges lower and sinks to $2.56 on Monday, extending its losing streak for the fifth day in a row. The move comes on the back of China cutting its Liquified Natural Gas (LNG) imports after prices rose above $3.0 in June. It
Author  FXStreet
Jul 01, 2024
Natural Gas price (XNG/USD) edges lower and sinks to $2.56 on Monday, extending its losing streak for the fifth day in a row. The move comes on the back of China cutting its Liquified Natural Gas (LNG) imports after prices rose above $3.0 in June. It
placeholder
The dollar weakened, equities dipped, and gold hit record highsThe dollar weakened, equities fell, and gold set new records on Wednesday as investors waited for a Fed rate cut later in the day.
Author  Cryptopolitan
Sep 17, 2025
The dollar weakened, equities fell, and gold set new records on Wednesday as investors waited for a Fed rate cut later in the day.
placeholder
Markets in 2026: Will gold, Bitcoin, and the U.S. dollar make history again? — These are how leading institutions thinkAfter a turbulent 2025, what lies ahead for commodities, forex, and cryptocurrency markets in 2026?
Author  Insights
Dec 25, 2025
After a turbulent 2025, what lies ahead for commodities, forex, and cryptocurrency markets in 2026?
placeholder
ECB Policy Outlook for 2026: What It Could Mean for the Euro’s Next MoveWith the ECB likely holding rates steady at 2.15% and the Fed potentially extending cuts into 2026, EUR/USD may test 1.20 if Eurozone growth proves resilient, but weaker growth and an ECB pivot could pull the pair back toward 1.13 and potentially 1.10.
Author  Mitrade
Dec 26, 2025
With the ECB likely holding rates steady at 2.15% and the Fed potentially extending cuts into 2026, EUR/USD may test 1.20 if Eurozone growth proves resilient, but weaker growth and an ECB pivot could pull the pair back toward 1.13 and potentially 1.10.
placeholder
Gold tumbles below $4,650 as inflation fears and liquidity squeeze weighGold price (XAU/USD) remains under selling pressure near $4,640 during the early Asian session on Friday. The precious metal extends the decline as soaring crude oil and energy prices, driven by the escalating US-Israeli war with Iran, reignite inflation fears.
Author  FXStreet
Yesterday 01: 22
Gold price (XAU/USD) remains under selling pressure near $4,640 during the early Asian session on Friday. The precious metal extends the decline as soaring crude oil and energy prices, driven by the escalating US-Israeli war with Iran, reignite inflation fears.
Related Instrument
goTop
quote