


Canadian Dollar sheds weight on risk-off Monday
- he Canadian Dollar continues to lose ground to the Greenback.
- Markets have tilted into a broadly risk-off stance to kick off the new week.
- Canada remains largely absent from the economic calendar until Friday.
The Canadian Dollar (CAD) backslid into long-term averages against the US Dollar on Monday, with markets opening up the new trading week notably on the back foot. Investors pulled back into the safety of the Greenback, sending the Canadian Dollar skidding into three-week lows.
Meaningful economic data from Canada remains entirely absent from the economic data docket this week, at least until fresh prints in Canadian labor data, due on Friday. Canadian Trade Balance figures are due on Tuesday but are almost guaranteed to have little to no market impact.
Daily digest market movers
- Rising risk-off sentiment pummels the CAD on Monday.
- Markets are facing a lower forecast for the pace of rate cuts than many expected earlier in the year.
- Odds of further outsized rate cuts from the Fed are evaporating as the US labor market remains stubbornly healthy.
- Fed remains tepid on further rate cuts, bets of no rate change in November are on the rise.
- Fed's Kashkari: Balance of risks has tilted toward higher unemployment
Canadian Dollar price forecast
USD/CAD is currently trading at 1.36245, having recently bounced from the 1.3500 level. Notably, price action has moved above the 200-day Exponential Moving Average (EMA), a critical level that often signals a shift in trend direction when breached. The break above this longer-term EMA suggests that bullish momentum may be gaining traction, and this level could act as a new support zone.
Additionally, the 50-day EMA is slightly below the current price, further reinforcing the bullish outlook. The crossing above both the 50-day and 200-day EMAs in quick succession strengthens the case for a potential rally in the coming days, assuming no significant pullback occurs.
The MACD histogram also indicates a bullish shift, as the MACD line (blue) has crossed above the signal line (orange), suggesting an increase in upward momentum. This crossover, along with a steadily rising histogram, points to a potential continuation of the upward movement.
However, it’s important to note that the pair is approaching resistance near the 1.3650 level, which has previously acted as a strong psychological and technical barrier. If USD/CAD manages to break and sustain above this level, it could open the door for further gains, with the next key resistance zone around 1.3800.
USD/CAD daily chart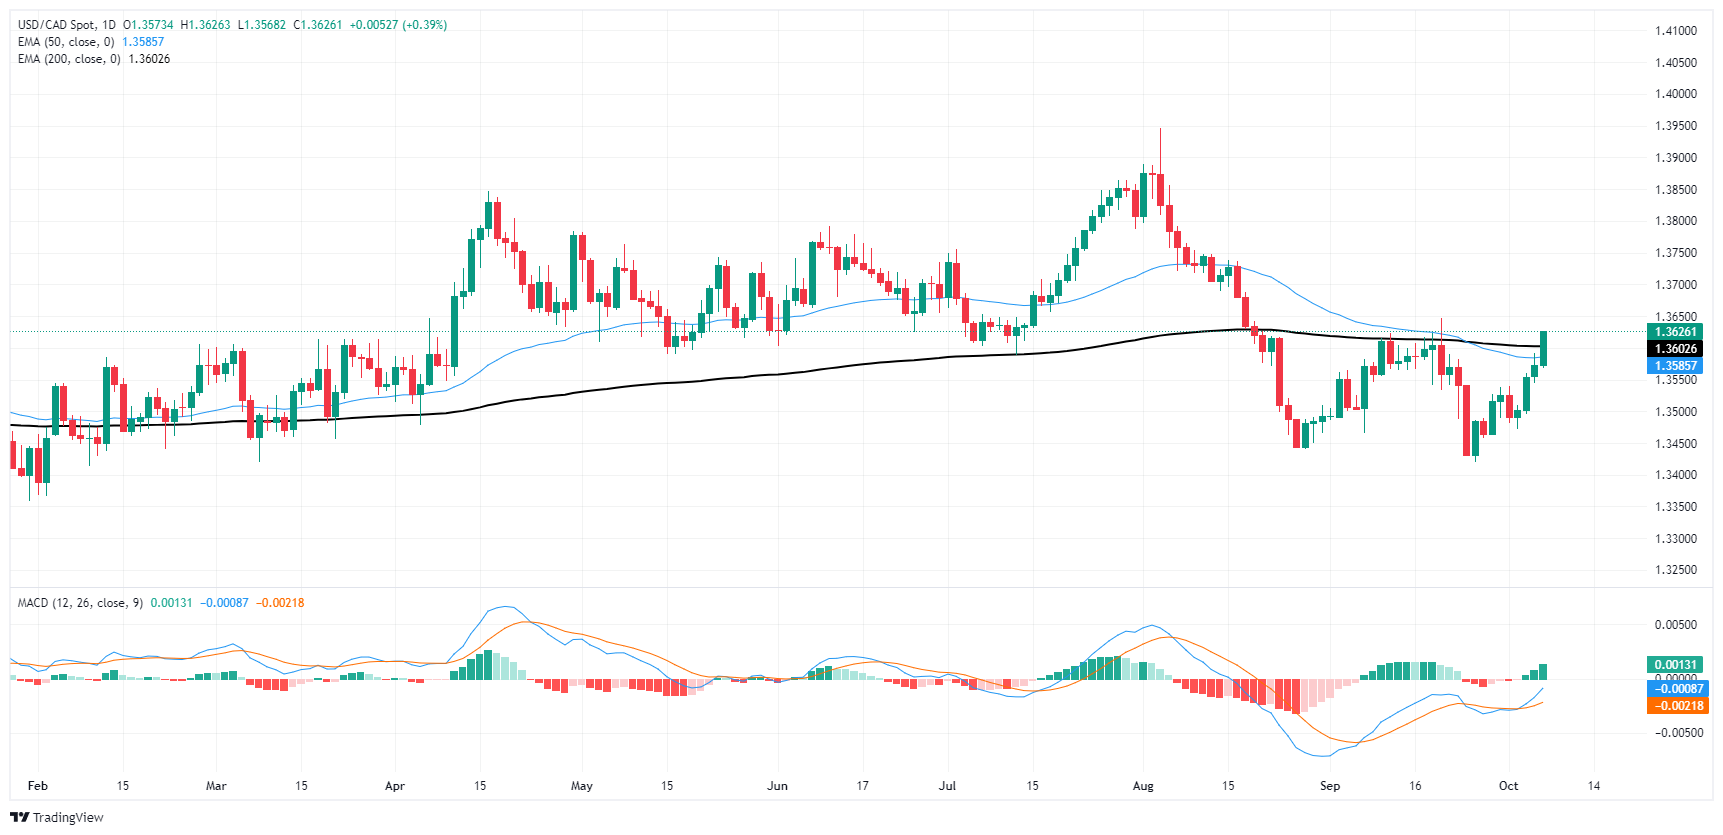
Canadian Dollar FAQs
The key factors driving the Canadian Dollar (CAD) are the level of interest rates set by the Bank of Canada (BoC), the price of Oil, Canada’s largest export, the health of its economy, inflation and the Trade Balance, which is the difference between the value of Canada’s exports versus its imports. Other factors include market sentiment – whether investors are taking on more risky assets (risk-on) or seeking safe-havens (risk-off) – with risk-on being CAD-positive. As its largest trading partner, the health of the US economy is also a key factor influencing the Canadian Dollar.
The Bank of Canada (BoC) has a significant influence on the Canadian Dollar by setting the level of interest rates that banks can lend to one another. This influences the level of interest rates for everyone. The main goal of the BoC is to maintain inflation at 1-3% by adjusting interest rates up or down. Relatively higher interest rates tend to be positive for the CAD. The Bank of Canada can also use quantitative easing and tightening to influence credit conditions, with the former CAD-negative and the latter CAD-positive.
The price of Oil is a key factor impacting the value of the Canadian Dollar. Petroleum is Canada’s biggest export, so Oil price tends to have an immediate impact on the CAD value. Generally, if Oil price rises CAD also goes up, as aggregate demand for the currency increases. The opposite is the case if the price of Oil falls. Higher Oil prices also tend to result in a greater likelihood of a positive Trade Balance, which is also supportive of the CAD.
While inflation had always traditionally been thought of as a negative factor for a currency since it lowers the value of money, the opposite has actually been the case in modern times with the relaxation of cross-border capital controls. Higher inflation tends to lead central banks to put up interest rates which attracts more capital inflows from global investors seeking a lucrative place to keep their money. This increases demand for the local currency, which in Canada’s case is the Canadian Dollar.
Macroeconomic data releases gauge the health of the economy and can have an impact on the Canadian Dollar. Indicators such as GDP, Manufacturing and Services PMIs, employment, and consumer sentiment surveys can all influence the direction of the CAD. A strong economy is good for the Canadian Dollar. Not only does it attract more foreign investment but it may encourage the Bank of Canada to put up interest rates, leading to a stronger currency. If economic data is weak, however, the CAD is likely to fall.
Recommended Articles


