

Australian Dollar holds losses after Building Permits data
- The Australian Dollar loses ground due to increased risk aversion on Tuesday.
- Australia's Building Permits declined by 6.5% MoM in June, swinging from a 5.7% increase in May.
- The US Dollar could lose ground due to increased odds of a Fed rate cut in September.
The Australian Dollar (AUD) edges lower against the US Dollar (USD) following the release of Building Permits data on Tuesday. Australia's Consumer Price Index (CPI) data will be released on Wednesday, offering potential insights into the future direction of the Reserve Bank of Australia’s (RBA) monetary policy. Analysts anticipate a slight re-acceleration in Australia’s headline inflation for the second quarter, with the core rate likely remaining steady.
This inflation report will be pivotal in determining whether the RBA will opt for a rate hike at its policy meeting next week. However, economists have cautioned that an additional increase in interest rates could jeopardize Australia’s economic recovery.
The AUD/USD pair may limit its downside as the US Dollar could face challenges due to heightened expectations of the Federal Reserve’s (Fed) interest rate cut in September. Additionally, signs of cooling inflation and easing labor market conditions in the United States have fueled expectations of three rate cuts by the Fed this year. The Fed's Interest Rate Decision will be a focal point on Wednesday.
Daily Digest Market Movers: Australian Dollar declines due to risk-off mood
- Australia's Building Permits (MoM) fell by 6.5% in June, exceeding market expectations of a 3.0% decline. This follows a 5.7% increase in May. On a year-over-year basis, Building Permits declined by 3.7%, compared to the previous year's decline of 8.5%.
- National Australia Bank (NAB) anticipates that the Reserve Bank of Australia's (RBA) cash rate will remain stable at 4.35% until May 2025, according to a recent NAB Economics outlook. Looking ahead, the NAB Economics team predicts a decline to 3.6% by December 2025, with further decreases expected in 2026.
- In a media release on Monday, the Australian Prudential Regulation Authority (APRA) warned that arrears rates are increasing slowly. Following their latest quarterly assessment of domestic and international economic conditions, APRA announced that they will keep macroprudential policy settings on hold. These comments reflect their ongoing evaluation of both domestic and global economic environments.
- On Friday, the US Personal Consumption Expenditures (PCE) Price Index rose by 2.5% year-over-year in June, down slightly from 2.6% in May, meeting market expectations. On a monthly basis, the PCE Price Index increased by 0.1% after being unchanged in May.
- The US Core PCE inflation, which excludes volatile food and energy prices, also climbed to 2.6% in June, consistent with May's increase and above the forecast of 2.5%. The core PCE Price Index rose by 0.2% month-over-month in June, compared to 0.1% in May.
- Bank of America suggests that robust economic growth in the United States enables the Federal Open Market Committee (FOMC) to "afford to wait" before implementing any adjustments. The BofA notes that the economy "remains strong" and expects the Fed to begin rate cuts in December.
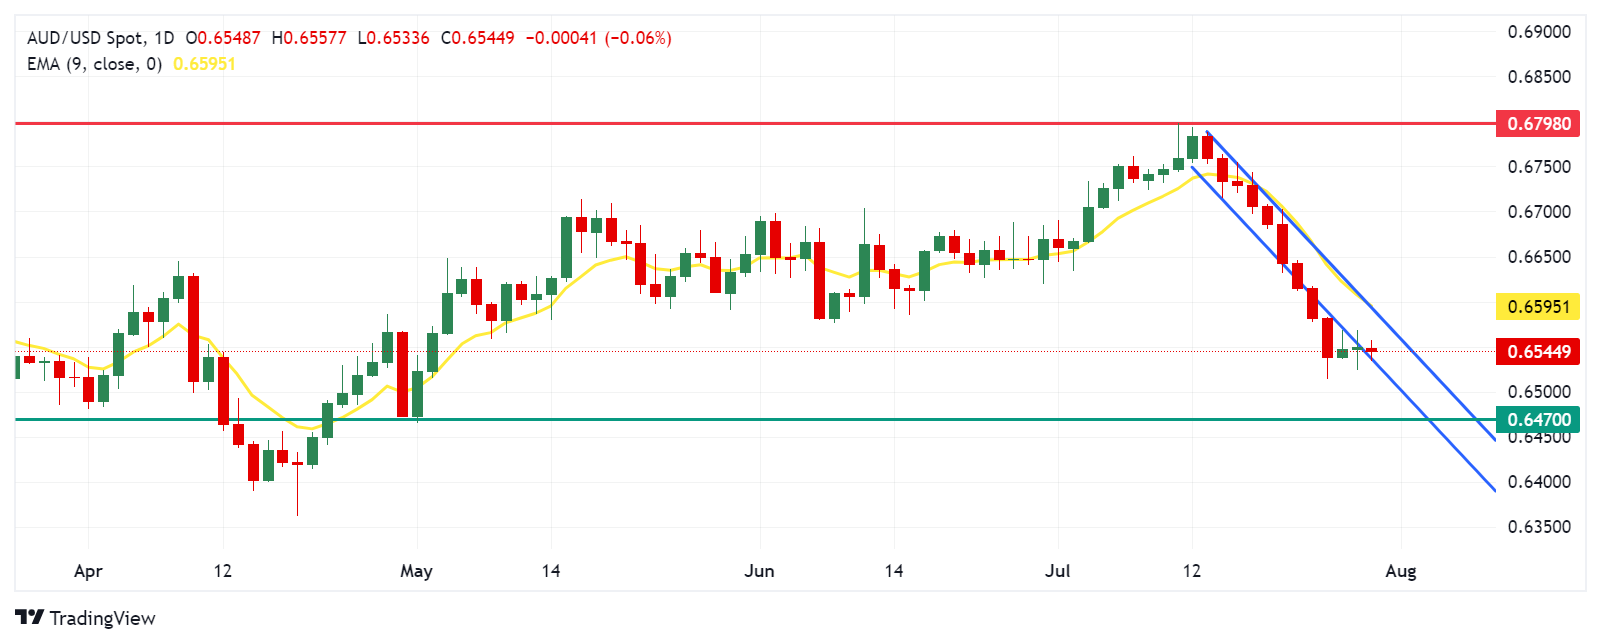
Technical Analysis: Australian Dollar hovers around 0.6550
The Australian Dollar trades around 0.6550 on Tuesday. The daily chart analysis shows that the AUD/USD pair treks the path of a downtrend line. The 14-day Relative Strength Index (RSI) is hovering at the oversold 30 level, indicating that the currency pair may be poised for a potential upward correction soon.
The AUD/USD pair could find immediate support around the key level of 0.6540. A break below this level could exert pressure on the pair to navigate the region around the throwback support at the 0.6470 level.
On the upside, key resistance is at the nine-day Exponential Moving Average (EMA) at 0.6595. A break above this level could lead the AUD/USD pair to test the psychological level of 0.6690, with a potential aim for a six-month high of 0.6798.
AUD/USD: Daily Chart
Australian Dollar PRICE Today
The table below shows the percentage change of Australian Dollar (AUD) against listed major currencies today. Australian Dollar was the strongest against the British Pound.
| USD | EUR | GBP | JPY | CAD | AUD | NZD | CHF | |
|---|---|---|---|---|---|---|---|---|
| USD | 0.05% | 0.10% | 0.03% | 0.03% | 0.06% | -0.01% | 0.06% | |
| EUR | -0.05% | 0.06% | 0.00% | -0.00% | 0.00% | -0.05% | 0.01% | |
| GBP | -0.10% | -0.06% | -0.04% | -0.07% | -0.03% | -0.09% | -0.05% | |
| JPY | -0.03% | 0.00% | 0.04% | -0.02% | 0.02% | -0.05% | 0.02% | |
| CAD | -0.03% | 0.00% | 0.07% | 0.02% | 0.04% | -0.03% | 0.01% | |
| AUD | -0.06% | -0.01% | 0.03% | -0.02% | -0.04% | -0.08% | -0.03% | |
| NZD | 0.00% | 0.05% | 0.09% | 0.05% | 0.03% | 0.08% | 0.06% | |
| CHF | -0.06% | -0.01% | 0.05% | -0.02% | -0.01% | 0.03% | -0.06% |
The heat map shows percentage changes of major currencies against each other. The base currency is picked from the left column, while the quote currency is picked from the top row. For example, if you pick the Australian Dollar from the left column and move along the horizontal line to the US Dollar, the percentage change displayed in the box will represent AUD (base)/USD (quote).
Australian Dollar FAQs
One of the most significant factors for the Australian Dollar (AUD) is the level of interest rates set by the Reserve Bank of Australia (RBA). Because Australia is a resource-rich country another key driver is the price of its biggest export, Iron Ore. The health of the Chinese economy, its largest trading partner, is a factor, as well as inflation in Australia, its growth rate and Trade Balance. Market sentiment – whether investors are taking on more risky assets (risk-on) or seeking safe-havens (risk-off) – is also a factor, with risk-on positive for AUD.
The Reserve Bank of Australia (RBA) influences the Australian Dollar (AUD) by setting the level of interest rates that Australian banks can lend to each other. This influences the level of interest rates in the economy as a whole. The main goal of the RBA is to maintain a stable inflation rate of 2-3% by adjusting interest rates up or down. Relatively high interest rates compared to other major central banks support the AUD, and the opposite for relatively low. The RBA can also use quantitative easing and tightening to influence credit conditions, with the former AUD-negative and the latter AUD-positive.
China is Australia’s largest trading partner so the health of the Chinese economy is a major influence on the value of the Australian Dollar (AUD). When the Chinese economy is doing well it purchases more raw materials, goods and services from Australia, lifting demand for the AUD, and pushing up its value. The opposite is the case when the Chinese economy is not growing as fast as expected. Positive or negative surprises in Chinese growth data, therefore, often have a direct impact on the Australian Dollar and its pairs.
Iron Ore is Australia’s largest export, accounting for $118 billion a year according to data from 2021, with China as its primary destination. The price of Iron Ore, therefore, can be a driver of the Australian Dollar. Generally, if the price of Iron Ore rises, AUD also goes up, as aggregate demand for the currency increases. The opposite is the case if the price of Iron Ore falls. Higher Iron Ore prices also tend to result in a greater likelihood of a positive Trade Balance for Australia, which is also positive of the AUD.
The Trade Balance, which is the difference between what a country earns from its exports versus what it pays for its imports, is another factor that can influence the value of the Australian Dollar. If Australia produces highly sought after exports, then its currency will gain in value purely from the surplus demand created from foreign buyers seeking to purchase its exports versus what it spends to purchase imports. Therefore, a positive net Trade Balance strengthens the AUD, with the opposite effect if the Trade Balance is negative.
Recommended Articles


