

GBP/USD hung up on Monday ahead of back-to-back central bank showings
- Fed and BoE both slated to make rate calls this week.
- Fed expected to hold, BoE forecast to cut rates 25 bps.
- US NFP jobs report looms ahead on Friday.
GBP/USD pulled into the midrange on Monday as Cable traders brace for a double-header of rate calls from both the Federal Reserve (Fed) and the Bank of England (BoE) later in the week. The Fed is broadly expected to hold steady on rates one more time on Wednesday, while markets are hoping for a first quarter-point rate cut from the BoE on Thursday.
Forex Today: Flash GDPs in Europe and US jobs in the spotlight
The Fed’s upcoming rate call on Wednesday will be closely watched as investors look for signs that the Fed is on pace to deliver a hotly-anticipated rate cut when the Federal Open Market Comittee (FOMC) convenes again in September. Markets are broadly anticipating at least a quarter-point rate cut on September 18, with rate markets pricing in 90% odds of a 25 bps trim and hopeful 10% bets for a double-cut according to the CME’s FedWatch Tool.
The BoE is broadly expected to deliver a quarter-point rate trim later this week on Thursday, but odds are still up in the air with the Monetary Policy Committee (MPC) forecast to vote 5–to-4 in favor of a 25 bps rate cut. At the BoE’s previous rate meeting, the MPC voted 7-to-2 in favor of keeping rate cuts on hold.
US Nonfarm Payrolls (NFP) are also due on Friday. They are a key component of the Fed’s employment mandate, and investors will be looking for a continued cooling in hiring figures to help push the Fed into a new rate-cutting cycle in September. ADP Employment Change figures for July will be published on Wednesday and will serve as a forecast for Friday’s NFP jobs report, albeit a shaky one with a spotty track record for accuracy.
GBP/USD technical outlook
Cable explored the low side on Monday, dipping into a fresh two-week low of 1.2807, but GBP bidders are still not ready to let the pair slip below the 1.2800 handle. The pair is holding north of the 50-day Exponential Moving Average (EMA) at 1.2787, with price action still pinned into the bullish side of the 200-day EMA at 1.2651.
GBP/USD punched in a fresh 12-month high the week before last, but a lack of bullish momentum has dragged bids back down and the pair has pared back -1.82% top-to-bottom. Significant headwinds from the 1.3000 handle are keeping bullish action on the low side, and it won’t take much for sellers to form a cluster and push Cable below the last swing low and challenge the 1.2600 handle.
GBP/USD daily chart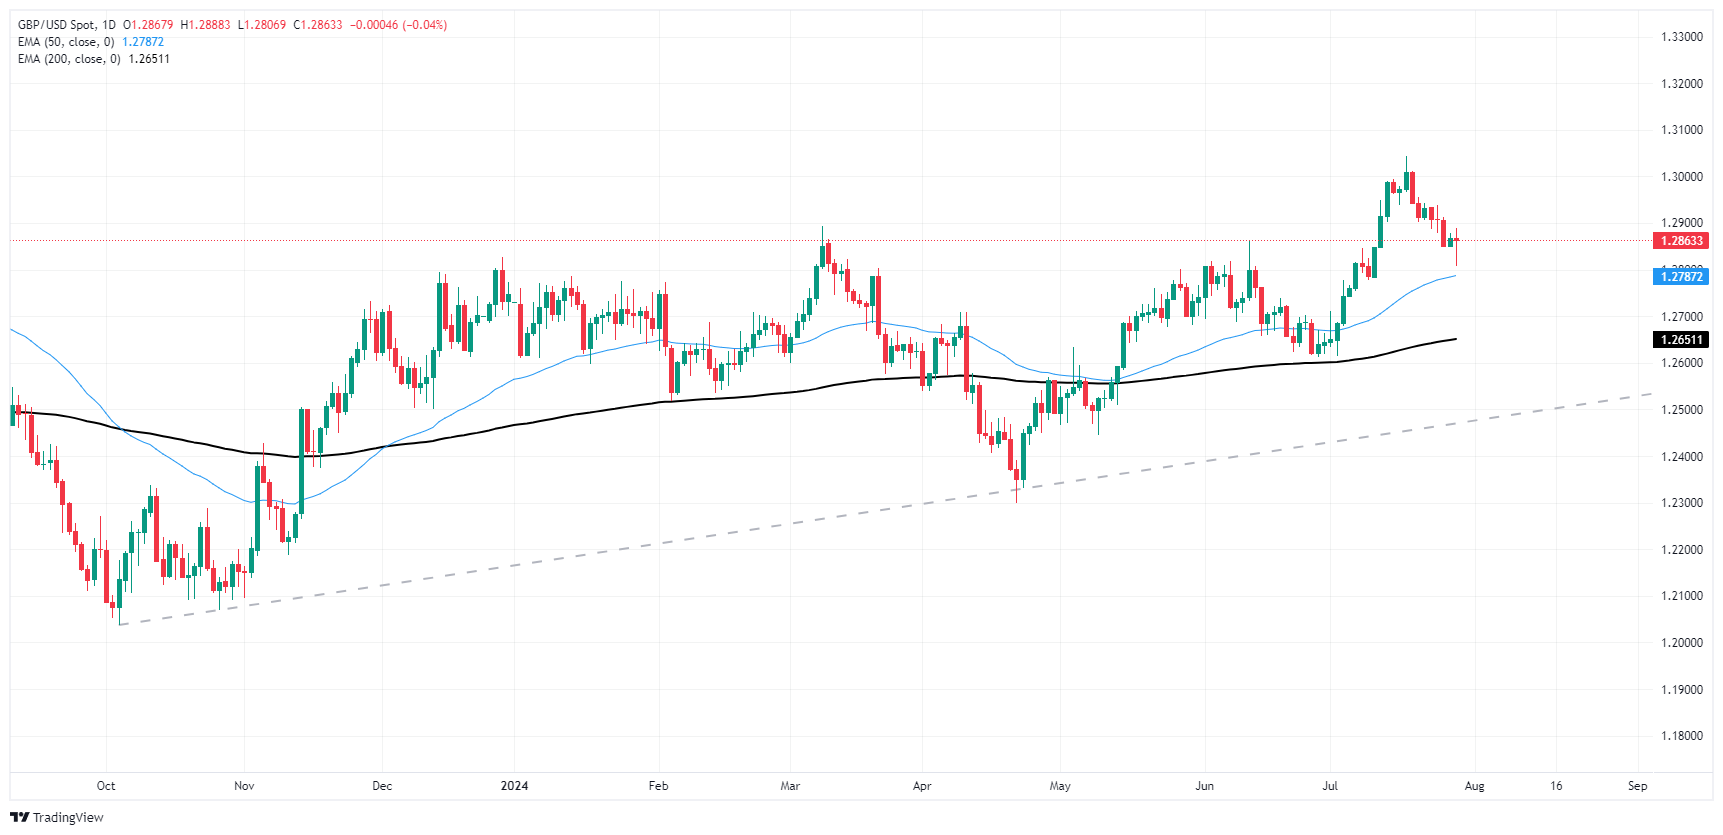
Pound Sterling FAQs
The Pound Sterling (GBP) is the oldest currency in the world (886 AD) and the official currency of the United Kingdom. It is the fourth most traded unit for foreign exchange (FX) in the world, accounting for 12% of all transactions, averaging $630 billion a day, according to 2022 data. Its key trading pairs are GBP/USD, aka ‘Cable’, which accounts for 11% of FX, GBP/JPY, or the ‘Dragon’ as it is known by traders (3%), and EUR/GBP (2%). The Pound Sterling is issued by the Bank of England (BoE).
The single most important factor influencing the value of the Pound Sterling is monetary policy decided by the Bank of England. The BoE bases its decisions on whether it has achieved its primary goal of “price stability” – a steady inflation rate of around 2%. Its primary tool for achieving this is the adjustment of interest rates. When inflation is too high, the BoE will try to rein it in by raising interest rates, making it more expensive for people and businesses to access credit. This is generally positive for GBP, as higher interest rates make the UK a more attractive place for global investors to park their money. When inflation falls too low it is a sign economic growth is slowing. In this scenario, the BoE will consider lowering interest rates to cheapen credit so businesses will borrow more to invest in growth-generating projects.
Data releases gauge the health of the economy and can impact the value of the Pound Sterling. Indicators such as GDP, Manufacturing and Services PMIs, and employment can all influence the direction of the GBP. A strong economy is good for Sterling. Not only does it attract more foreign investment but it may encourage the BoE to put up interest rates, which will directly strengthen GBP. Otherwise, if economic data is weak, the Pound Sterling is likely to fall.
Another significant data release for the Pound Sterling is the Trade Balance. This indicator measures the difference between what a country earns from its exports and what it spends on imports over a given period. If a country produces highly sought-after exports, its currency will benefit purely from the extra demand created from foreign buyers seeking to purchase these goods. Therefore, a positive net Trade Balance strengthens a currency and vice versa for a negative balance.
Recommended Articles


