


USD/INR extends gains on US Dollar demand, US Retail Sales data loom
- The Indian Rupee loses momentum in Tuesday’s Asian session amid a stronger Greenback.
- India’s foreign fund inflows, rising Fed rate cut bets, and lower crude oil prices might cap the INR’s downside.
- Investors await the US June Retail Sales and Fed’s Kugler speech on Tuesday.
The Indian Rupee (INR) extends downside on Tuesday as the US Dollar (USD) strengthened across the board. The weakness in the Chinese Yuan after slower-than-expected economic growth in China for the second quarter might weigh on Asian currencies, including the INR.
Nonetheless, the significant India’s foreign fund inflows and the rising odds of the US Federal Reserve (Fed) rate cuts in September could limit the loss in the local currency. Also, the fall in crude oil prices underpin the INR as India was the third-largest oil consumer after the United States (US) and China. Later on Tuesday, investors will monitor the US Retail Sales for June and the speech from the Federal Reserve’s (Fed) Adriana Kugler.
Daily Digest Market Movers: Indian Rupee remains sensitive to global factors and risk sentiment
- India’s Wholesale Price Index (WPI) Inflation rose to a 16-month high of 3.36% YoY in June from 2.61% in May, according to the latest official data released on Monday. This figure was weaker than the 3.50% expected.
- "Positive rate of inflation in June, 2024 is primarily due to increase in prices of food articles, manufacture of food products, crude petroleum & natural gas, mineral oils, other manufacturing etc," said the official press release.
- Indian WPI Food came in at 10.87% YoY in June, compared to 9.82% in May. Meanwhile, the WPI Fuel arrived at 1.03% versus 1.35% earlier.
- Fed Chair Jerome Powell said on Monday that the US has performed remarkably well in recent years, adding that the central bank won't be waiting until inflation reaches the 2% annual target.
- Federal Reserve Bank of San Francisco President Mary Daly did not provide time-based rate cut guidance but acknowledged significant progress on inflation.
Technical analysis: USD/INR sticks to the consolidation scheme in the short-term
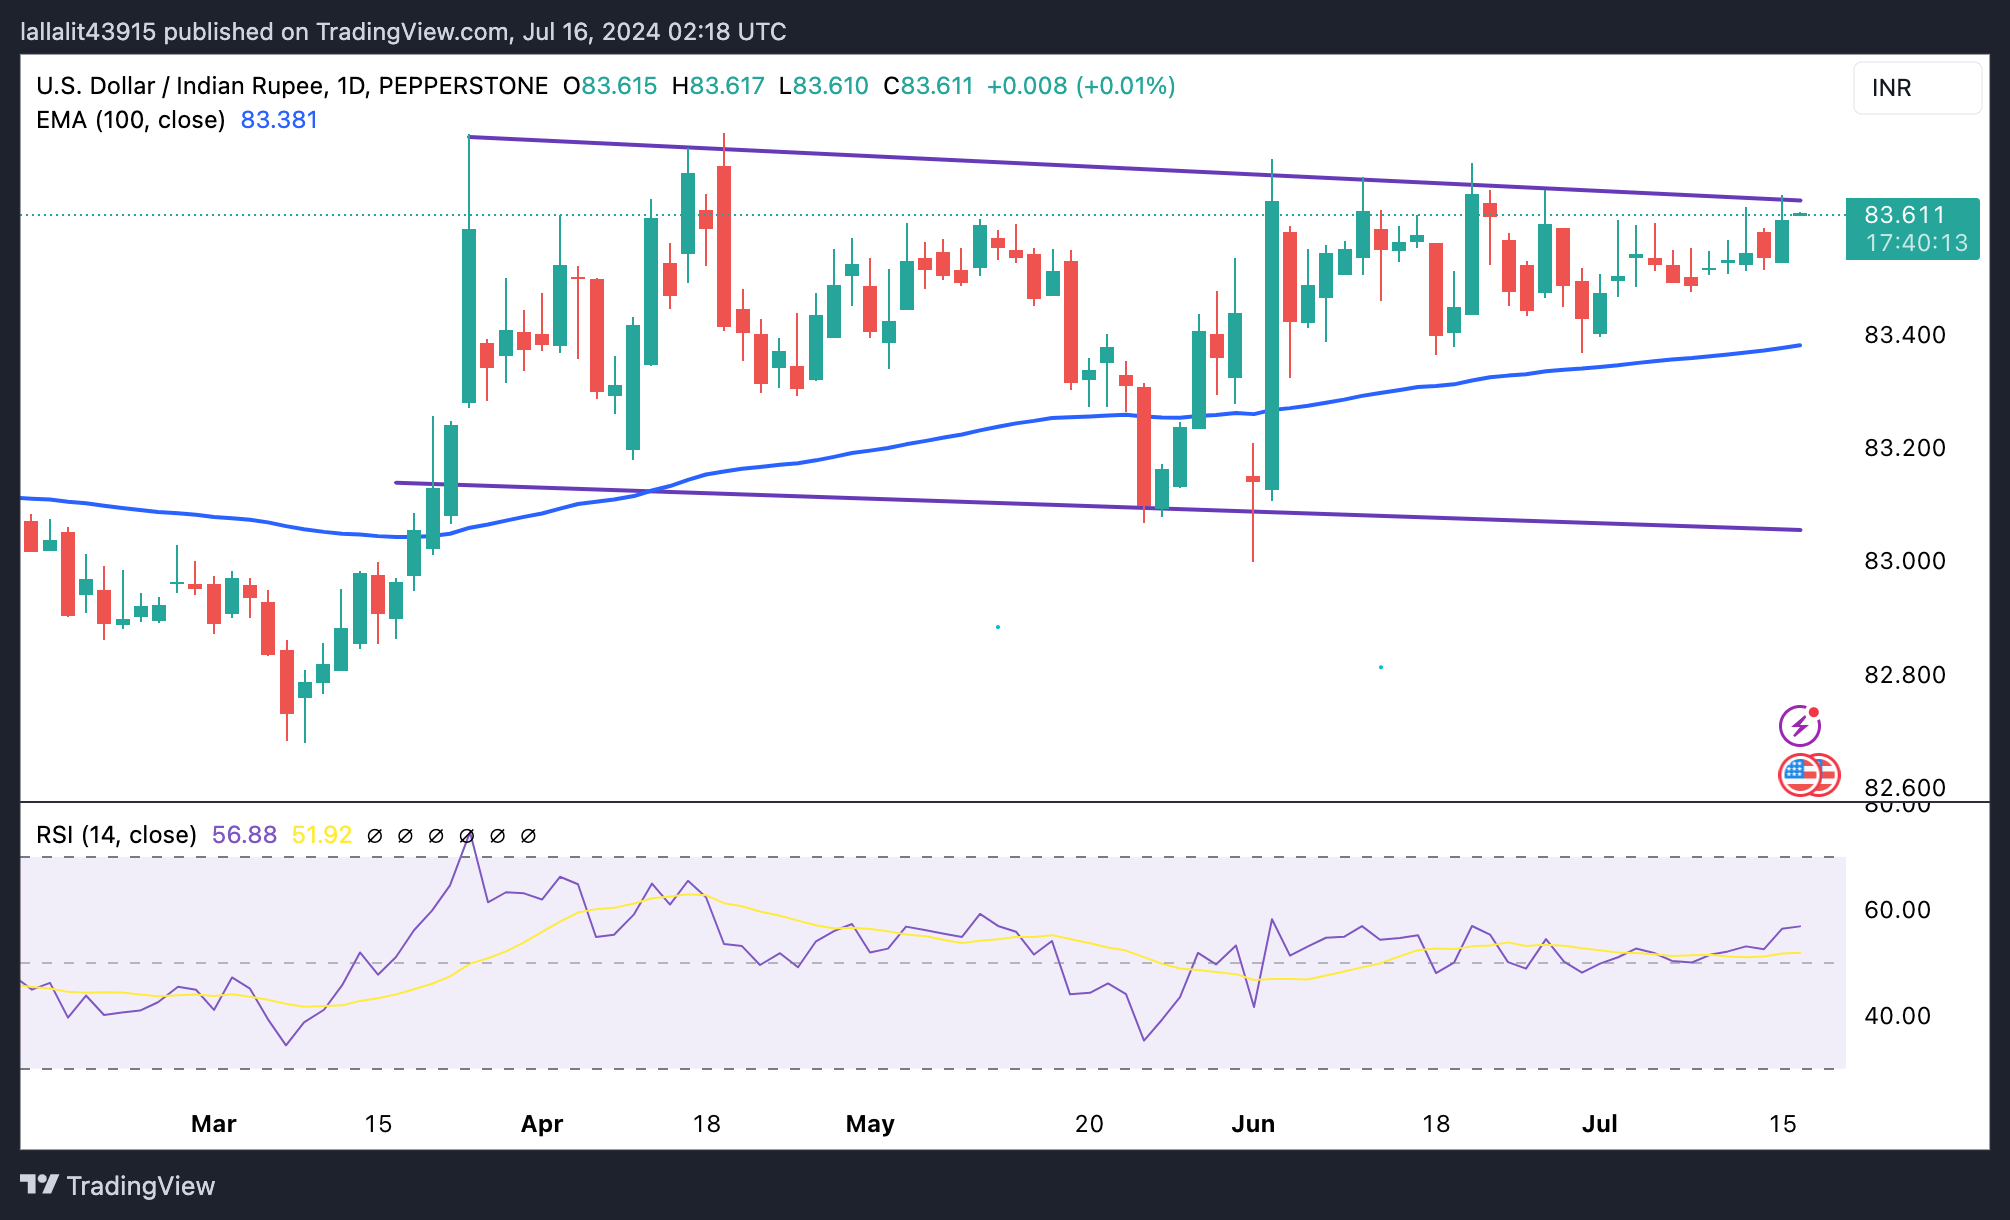
The Indian Rupee weakens on the day. The trend of the USD/INR pair appears to be bullish, with the pair holding above the key 100-day Exponential Moving Average (EMA) on the daily chart. Additionally, the 14-day Relative Strength Index (RSI) points higher above 56.40, indicating that further upside looks favorable.
In the near term, the pair has traded within its month-long trading range since March 21.
A move past the resistance area at the upper boundary of the trading range at 83.65 could clear the way for a move back to the all-time high of 83.75. The next upside barrier will emerge at the 84.00 psychological level.
On the other hand, the initial target could be the support level around the 100-day EMA at 83.37. If bearish momentum continues, look for further downside toward the 83.00 round figure, followed by 82.82, a low of January 12.
Indian Rupee FAQs
The Indian Rupee (INR) is one of the most sensitive currencies to external factors. The price of Crude Oil (the country is highly dependent on imported Oil), the value of the US Dollar – most trade is conducted in USD – and the level of foreign investment, are all influential. Direct intervention by the Reserve Bank of India (RBI) in FX markets to keep the exchange rate stable, as well as the level of interest rates set by the RBI, are further major influencing factors on the Rupee.
The Reserve Bank of India (RBI) actively intervenes in forex markets to maintain a stable exchange rate, to help facilitate trade. In addition, the RBI tries to maintain the inflation rate at its 4% target by adjusting interest rates. Higher interest rates usually strengthen the Rupee. This is due to the role of the ‘carry trade’ in which investors borrow in countries with lower interest rates so as to place their money in countries’ offering relatively higher interest rates and profit from the difference.
Macroeconomic factors that influence the value of the Rupee include inflation, interest rates, the economic growth rate (GDP), the balance of trade, and inflows from foreign investment. A higher growth rate can lead to more overseas investment, pushing up demand for the Rupee. A less negative balance of trade will eventually lead to a stronger Rupee. Higher interest rates, especially real rates (interest rates less inflation) are also positive for the Rupee. A risk-on environment can lead to greater inflows of Foreign Direct and Indirect Investment (FDI and FII), which also benefit the Rupee.
Higher inflation, particularly, if it is comparatively higher than India’s peers, is generally negative for the currency as it reflects devaluation through oversupply. Inflation also increases the cost of exports, leading to more Rupees being sold to purchase foreign imports, which is Rupee-negative. At the same time, higher inflation usually leads to the Reserve Bank of India (RBI) raising interest rates and this can be positive for the Rupee, due to increased demand from international investors. The opposite effect is true of lower inflation.
Recommended Articles


