AUD/JPY Price Analysis: Pair slides below 107.00, bearish sentiment increase

Source Fxstreet
  • AUD/JPY slips towards 106.90, breaching the 20-day SMA support.
  • A bearish sentiment is projected for the next few session, continuing the downtrend from last week.

In Monday's trading session, the AUD/JPY pair noted a further decline of 0.15% to fall to 106.90. This continues the observable trend from last week Thursday's session which saw a significant drop from above 109.00. The present conditions point towards a bearish outlook for the forthcoming sessions as sellers appear to continue their dominance.

The daily Relative Strength Index (RSI) for the AUD/JPY pair currently reads 53, showing a marginal plunge from last week’s high of 80, slowly pushing toward the bearish zone. Despite this shift, the market seems to retain its neutral stance as it remains in positive territory. Complementing this, the daily Moving Average Convergence Divergence (MACD) shows rising red bars, indicating potential weakness.

AUD/JPY daily chart

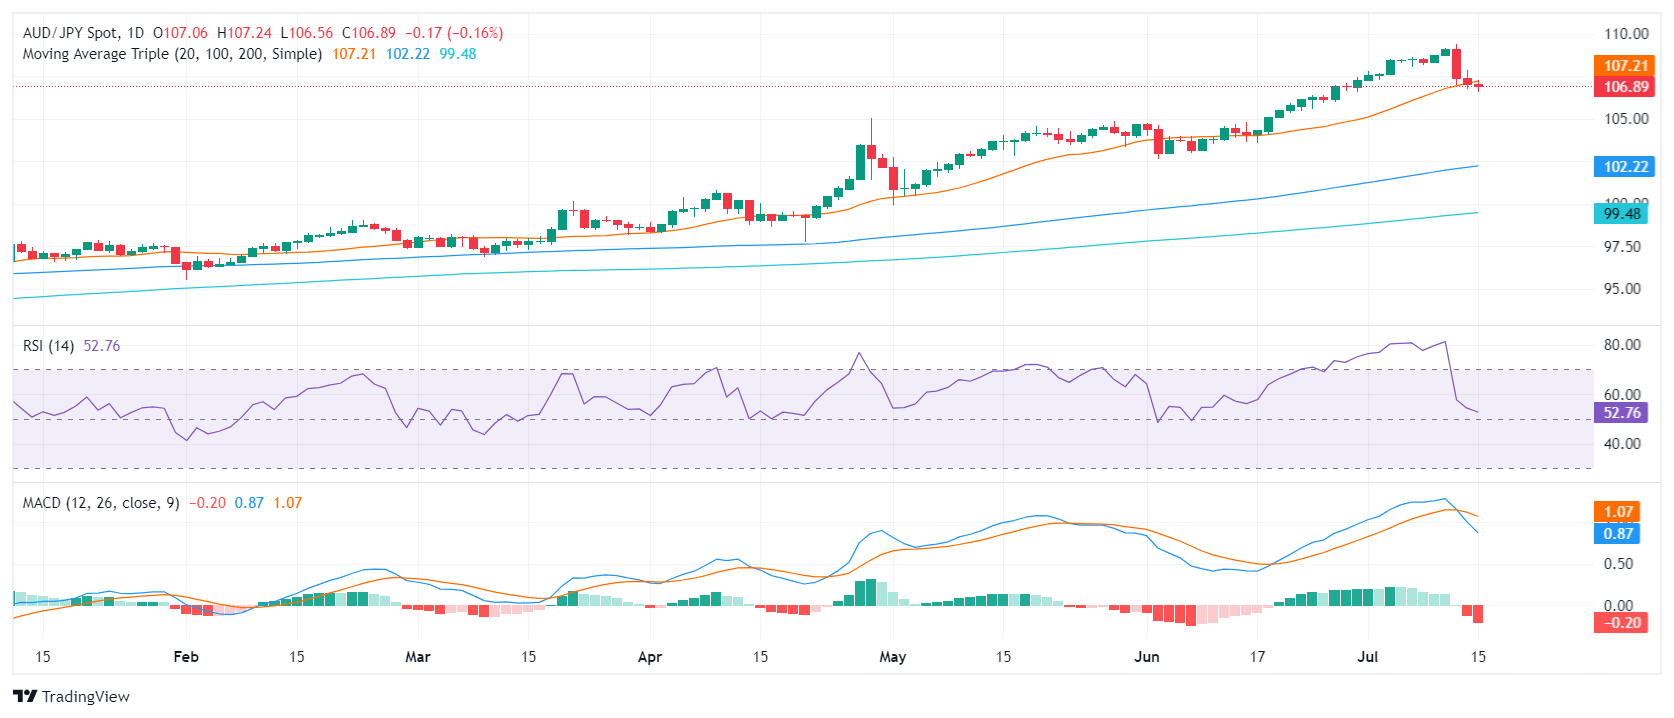
From a broader viewpoint, the AUD/JPY pair hints at a bearish sentiment, especially considering its position below the 20-day SMA support. Should further downward movement occur, the immediate support levels at 106.50 and 106.00 are pivotal marks to consider. Conversely, to mitigate further potential losses, buyers must aim to surpass the 107.00 level (20-day SMA) and aim towards the 108.00 barrier to signal recovery.

Disclaimer: For information purposes only. Past performance is not indicative of future results.
placeholder
2025 Black Friday is coming! Which stocks may see volatility?Coming on the day right after Thanksgiving in the United States, Back Friday marks the start of the holiday shopping season. Sales data from this shopping frenzy day reflects investor confidence and consumer trends. The National Retail Federation (NRF) predicts that holiday season (Nov and Dec) retail sales in 2025 will likely exceed $1 trillion for the very first time, which represents a year-over-year increase of 3.7 to 4.2 percent. Historic data from the past decade show that the retail sector has generally outperformed the S&P 500 during the weeks before and after Black Friday. The following retailing companies are expected to be big winners:
Author  Insights
Nov 24, Mon
Coming on the day right after Thanksgiving in the United States, Back Friday marks the start of the holiday shopping season. Sales data from this shopping frenzy day reflects investor confidence and consumer trends. The National Retail Federation (NRF) predicts that holiday season (Nov and Dec) retail sales in 2025 will likely exceed $1 trillion for the very first time, which represents a year-over-year increase of 3.7 to 4.2 percent. Historic data from the past decade show that the retail sector has generally outperformed the S&P 500 during the weeks before and after Black Friday. The following retailing companies are expected to be big winners:
placeholder
Bitcoin Bleeds to $86K, But This Key Indicator Screams "The Top Isn't In"Bitcoin’s adjusted Spent Output Profit Ratio (aSOPR) has spent nearly two years coiling below the extremes seen at past bull-market peaks, even as BTC trades around $86,300 and down 9% on the week — a setup that leaves open the possibility that this cycle’s true top may still lie ahead.
Author  Mitrade
Nov 25, Tue
Bitcoin’s adjusted Spent Output Profit Ratio (aSOPR) has spent nearly two years coiling below the extremes seen at past bull-market peaks, even as BTC trades around $86,300 and down 9% on the week — a setup that leaves open the possibility that this cycle’s true top may still lie ahead.
placeholder
Bitcoin Price Rebound Gains Traction with $90K Break in SightBitcoin is trading above $87,000 and its 100-hour SMA after rebounding from $83,500, with a bearish trend line at $88,200 and resistance at $89,000–$90,000 now in focus as BTC either breaks higher toward $91,750–$94,000 or slips back toward $86,700, $85,000 and lower supports.
Author  Mitrade
Yesterday 02: 58
Bitcoin is trading above $87,000 and its 100-hour SMA after rebounding from $83,500, with a bearish trend line at $88,200 and resistance at $89,000–$90,000 now in focus as BTC either breaks higher toward $91,750–$94,000 or slips back toward $86,700, $85,000 and lower supports.
placeholder
Bitcoin Targets $89K Breakout as S&P 500 Nears ATH on Fed Rate Cut HopesBitcoin price action shows signs of a potential short squeeze as it hovers near $88,000, with analysts watching liquidity dynamics that could push it toward $89,000 or retrace to $85,000.
Author  Mitrade
3 hours ago
Bitcoin price action shows signs of a potential short squeeze as it hovers near $88,000, with analysts watching liquidity dynamics that could push it toward $89,000 or retrace to $85,000.
placeholder
Ethereum Reclaims $3K Handle—Is a Breakout Imminent?Ethereum has jumped back above $3,000 and reclaimed key Fib levels, with a bullish trend line at $2,880 and strong MACD/RSI readings putting a breakout above $3,120–$3,165 — and a possible run toward $3,320–$3,350 — on the table, as long as support around $2,980–$2,920 holds.
Author  Mitrade
3 hours ago
Ethereum has jumped back above $3,000 and reclaimed key Fib levels, with a bullish trend line at $2,880 and strong MACD/RSI readings putting a breakout above $3,120–$3,165 — and a possible run toward $3,320–$3,350 — on the table, as long as support around $2,980–$2,920 holds.
goTop
quote