Japanese Yen gains ground due to rising expectations of BoJ rate hike, US CPI eyed

Source Fxstreet
  • The Japanese Yen strengthens as overseas investors anticipate the BoJ raising rates in July.
  • The Japanese government's 10-year JGB yield remains stable at around 1.09%, close to its recent high of 1.10%.
  • Fed Chair Powell highlighted the urgent need to monitor the deteriorating labor market.

The Japanese Yen (JPY) halts its three-day losing streak on Thursday. This upside is possibly driven by the rising speculation that the Bank of Japan (BoJ) might raise interest rates at its upcoming July meeting. This development supported the JPY while weakening the USD/JPY pair.

The Japanese government's 10-year JGB yield holds steady at approximately 1.09%, near its peak of 1.1% recorded on July 3. The stability comes amidst selling pressure on Japanese government bonds, reflecting overseas investors' anticipation that the Bank of Japan may raise interest rates in response to a weakening Japanese Yen, as reported by Nikkei Asia.

The US Dollar (USD) weakened, likely impacted by lower US Treasury yields. Fed Chair Jerome Powell highlighted the urgent need to monitor the deteriorating labor market on Wednesday while expressing optimism about the downward trajectory of inflation.

Traders are now eyeing the upcoming US Consumer Price Index (CPI) data for June, scheduled for release on Thursday, for more clarity on the Federal Reserve's (Fed) monetary policy direction.

Daily Digest Market Movers: Japanese Yen improves amid hawkish sentiment surrounding the BoJ

  • Peter Boockvar, chief financial officer at US-based Bleakley Financial Group, said that the Yen's weakness will trigger the BoJ to "react sooner rather than later," per Reuters.
  • Reuters reported on Wednesday, citing unnamed sources, the Bank of Japan will likely trim this year's economic growth forecast and project inflation will stay around its 2% target in coming years at its meeting this month.
  • Fed Chair Jerome Powell stated in his Congressional testimony on Tuesday, "More good data would strengthen our confidence in inflation." Powell emphasized that a "Policy rate cut is not appropriate until the Fed gains greater confidence that inflation is headed sustainably toward 2%." He also noted that "first-quarter data did not support the greater confidence in the inflation path that the Fed needs to cut rates."
  • According to a Bloomberg report on Tuesday, the Bank of Japan is conducting three in-person meetings with banks, securities firms, and financial institutions over the next few days. The purpose of these meetings is to assess a feasible pace for scaling back its purchases of Japanese Government Bonds.
  • On Tuesday, Japan's Finance Minister Shunichi Suzuki underscored the significance of maintaining fiscal discipline to bolster confidence in long-term fiscal health. Suzuki also mentioned monitoring closely the discussions at the BoJ meeting concerning the bond market, as reported by Reuters.
  • The Japanese Yen may struggle due to overseas asset purchases by Japanese individuals through the newly revamped tax-free investment scheme, the Nippon Individual Savings Account (NISA) program. According to Nikkei Asia, the scale of these purchases is expected to exceed the country's trade deficit during the first half of this year.
  • Japan’s Ministry of Finance reported on Monday that Japanese investment trust management companies and asset management firms bought ¥6.16 trillion ($38 billion) more in offshore equities and investment fund shares than they sold during the first six months of the year.

Technical Analysis: USD/JPY hovers around 161.50

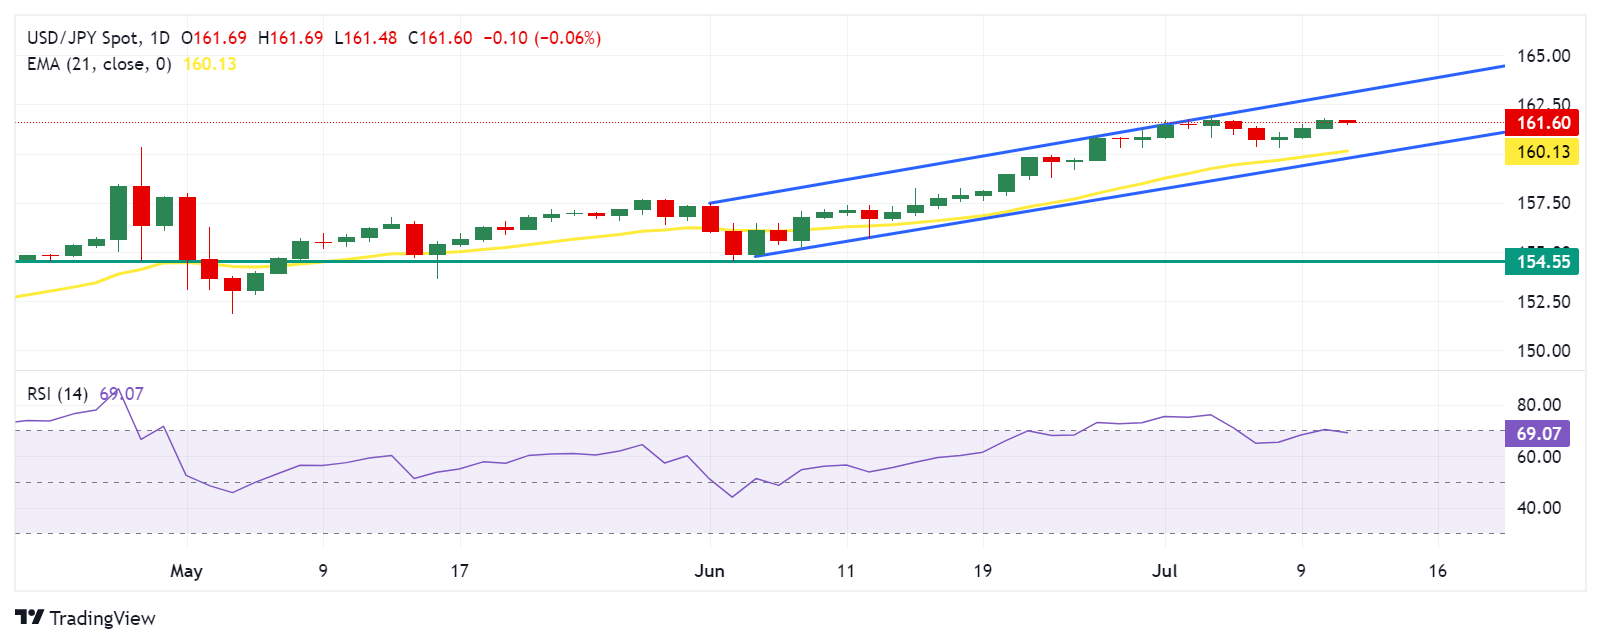
USD/JPY trades around 161.60 on Thursday, maintaining an upward trajectory within an ascending channel pattern, indicating a bullish bias according to daily chart analysis. Supporting this outlook, the 14-day Relative Strength Index (RSI) sits just below the 70 level, suggesting potential overbought conditions. A breach above this level could signal a need for caution and a possible correction.

The USD/JPY pair may aim for psychological resistance near 163.00, located at the upper boundary of the ascending channel. A successful breakout above this level could reinforce bullish sentiment, potentially pushing the pair toward significant resistance around 163.50.

Conversely, initial support is expected around the 21-day Exponential Moving Average (EMA) at 160.13. A drop below this level might trigger selling pressure, testing the lower boundary of the ascending channel near the psychological level of 160.00. A further decline below this channel support could see the pair revisiting June's low around 154.55.

USD/JPY: Daily Chart

Japanese Yen PRICE Today

The table below shows the percentage change of Japanese Yen (JPY) against listed major currencies today. Japanese Yen was the strongest against the US Dollar.

  USD EUR GBP JPY CAD AUD NZD CHF
USD   -0.08% -0.11% -0.08% -0.04% -0.23% -0.23% -0.10%
EUR 0.08%   -0.02% 0.00% 0.08% -0.14% -0.15% -0.01%
GBP 0.11% 0.02%   0.04% 0.08% -0.12% -0.13% 0.03%
JPY 0.08% 0.00% -0.04%   0.03% -0.16% -0.21% -0.02%
CAD 0.04% -0.08% -0.08% -0.03%   -0.22% -0.22% -0.06%
AUD 0.23% 0.14% 0.12% 0.16% 0.22%   -0.02% 0.14%
NZD 0.23% 0.15% 0.13% 0.21% 0.22% 0.02%   0.16%
CHF 0.10% 0.01% -0.03% 0.02% 0.06% -0.14% -0.16%  

The heat map shows percentage changes of major currencies against each other. The base currency is picked from the left column, while the quote currency is picked from the top row. For example, if you pick the Japanese Yen from the left column and move along the horizontal line to the US Dollar, the percentage change displayed in the box will represent JPY (base)/USD (quote).

Bank of Japan FAQs

The Bank of Japan (BoJ) is the Japanese central bank, which sets monetary policy in the country. Its mandate is to issue banknotes and carry out currency and monetary control to ensure price stability, which means an inflation target of around 2%.

The Bank of Japan has embarked in an ultra-loose monetary policy since 2013 in order to stimulate the economy and fuel inflation amid a low-inflationary environment. The bank’s policy is based on Quantitative and Qualitative Easing (QQE), or printing notes to buy assets such as government or corporate bonds to provide liquidity. In 2016, the bank doubled down on its strategy and further loosened policy by first introducing negative interest rates and then directly controlling the yield of its 10-year government bonds.

The Bank’s massive stimulus has caused the Yen to depreciate against its main currency peers. This process has exacerbated more recently due to an increasing policy divergence between the Bank of Japan and other main central banks, which have opted to increase interest rates sharply to fight decades-high levels of inflation. The BoJ’s policy of holding down rates has led to a widening differential with other currencies, dragging down the value of the Yen.

A weaker Yen and the spike in global energy prices have led to an increase in Japanese inflation, which has exceeded the BoJ’s 2% target. Still, the Bank judges that the sustainable and stable achievement of the 2% target has not yet come in sight, so any sudden change in the current policy looks unlikely.

Disclaimer: For information purposes only. Past performance is not indicative of future results.
placeholder
U.S. November Nonfarm Payrolls: What Does the Rare "Weak Jobs, Strong Economy" Mix Mean for U.S. Equities?1. IntroductionAfter retreating from the late-October highs, U.S. equities embarked on a bottoming rebound in mid-to-late November, a trend driven by the interplay of multiple factors. That said, it i
Author  TradingKey
10 hours ago
1. IntroductionAfter retreating from the late-October highs, U.S. equities embarked on a bottoming rebound in mid-to-late November, a trend driven by the interplay of multiple factors. That said, it i
placeholder
Senate Delays Crypto Market Structure Hearings to Early 2026The Senate Banking Committee has postponed cryptocurrency market structure hearings until 2026, citing ongoing bipartisan negotiations.
Author  Mitrade
15 hours ago
The Senate Banking Committee has postponed cryptocurrency market structure hearings until 2026, citing ongoing bipartisan negotiations.
placeholder
Bitcoin Slides 5% as Sellers Lean In — Can BTC Reclaim $88,000?Bitcoin has dropped back below $88,000 after rolling over from $90,500, with price still trading under the 100-hour Simple Moving Average. The sell-off found a floor at $85,151, and BTC is now consolidating near that base, but rebounds are facing pressure from a bearish trend line around $89,000. Bulls need to retake $88,000–$89,000 to ease downside risk; failure to do so keeps $85,500–$85,000 and then $83,500 in play, with $80,000 as the deeper “line in the sand.” Bitcoin (BTC) is back in damage-control mode after a sharp pullback wiped out recent gains. The price failed to reclaim the $90,000–$90,500 band, rolled over, and slid through $88,500 before briefly dipping under $87,000. Buyers did show up around $85,000, but the rebound so far looks more like stabilization than a clear trend reversal. Bitcoin dips hard, finds a bid near $85,000(h3) BTC’s latest move lower began when it couldn’t build follow-through above $90,000 and $90,500. Once that upside stalled, sellers took control and pushed price down through $88,500. The slide accelerated enough to spike below $87,000, but the market didn’t free-fall. Bulls defended the $85,000 zone, printing a low at $85,151. Since then, Bitcoin has been consolidating below the 23.6% Fibonacci retracement of the drop from the $93,560 swing high to the $85,151 low — a clue that the bounce is still shallow and that sellers haven’t fully backed off yet. Structurally, BTC is still on the back foot: It’s trading below $88,000, and It remains below the 100-hour Simple Moving Average, keeping short-term trend pressure pointed downward. Resistance is layered, and $89,000 is the problem area(h3) If bulls try to turn this into a recovery, they’ll have to climb through multiple ceilings in quick succession. First, BTC faces resistance around $87,150, followed by a more meaningful barrier near $87,500. From there, the market’s attention snaps back to $88,000 — the level BTC just lost and now needs to reclaim. A close back above $88,000 would improve the tone, but it doesn’t solve the bigger issue: there’s a bearish trend line on the hourly BTC/USD chart (Kraken feed) with resistance near $89,000, which also lines up with the next technical hurdle. If BTC can push through $89,000 and hold, the rebound could extend toward $90,000, with follow-through targets at $91,000 and $91,500. But until price clears that $88,000–$89,000 zone, rallies are at risk of being sold rather than chased. If BTC fails to reclaim resistance, the downside path is clear(h3) The near-term bear case is simple: if Bitcoin can’t climb back above the $87,000 area and keep traction, sellers may attempt another leg lower. Support levels line up like this: Immediate support: $85,500 First major support: $85,000 Next support: $83,500 Then $82,500 in the near term Below that, the major “don’t break this” level is still $80,000. If BTC slips under $80,000, the risk of acceleration to the downside increases significantly — not because it’s magic, but because it’s the kind of psychological and structural level that tends to trigger forced de-risking. Indicators: momentum still leans bearish(h3) The intraday indicators aren’t offering much comfort yet: Hourly MACD is losing pace in the bearish zone. Hourly RSI remains below 50, suggesting sellers still have the upper hand on short timeframes. So while the $85,000 defense held for now, the market hasn’t flipped bullish — it’s just stopped bleeding.
Author  Mitrade
18 hours ago
Bitcoin has dropped back below $88,000 after rolling over from $90,500, with price still trading under the 100-hour Simple Moving Average. The sell-off found a floor at $85,151, and BTC is now consolidating near that base, but rebounds are facing pressure from a bearish trend line around $89,000. Bulls need to retake $88,000–$89,000 to ease downside risk; failure to do so keeps $85,500–$85,000 and then $83,500 in play, with $80,000 as the deeper “line in the sand.” Bitcoin (BTC) is back in damage-control mode after a sharp pullback wiped out recent gains. The price failed to reclaim the $90,000–$90,500 band, rolled over, and slid through $88,500 before briefly dipping under $87,000. Buyers did show up around $85,000, but the rebound so far looks more like stabilization than a clear trend reversal. Bitcoin dips hard, finds a bid near $85,000(h3) BTC’s latest move lower began when it couldn’t build follow-through above $90,000 and $90,500. Once that upside stalled, sellers took control and pushed price down through $88,500. The slide accelerated enough to spike below $87,000, but the market didn’t free-fall. Bulls defended the $85,000 zone, printing a low at $85,151. Since then, Bitcoin has been consolidating below the 23.6% Fibonacci retracement of the drop from the $93,560 swing high to the $85,151 low — a clue that the bounce is still shallow and that sellers haven’t fully backed off yet. Structurally, BTC is still on the back foot: It’s trading below $88,000, and It remains below the 100-hour Simple Moving Average, keeping short-term trend pressure pointed downward. Resistance is layered, and $89,000 is the problem area(h3) If bulls try to turn this into a recovery, they’ll have to climb through multiple ceilings in quick succession. First, BTC faces resistance around $87,150, followed by a more meaningful barrier near $87,500. From there, the market’s attention snaps back to $88,000 — the level BTC just lost and now needs to reclaim. A close back above $88,000 would improve the tone, but it doesn’t solve the bigger issue: there’s a bearish trend line on the hourly BTC/USD chart (Kraken feed) with resistance near $89,000, which also lines up with the next technical hurdle. If BTC can push through $89,000 and hold, the rebound could extend toward $90,000, with follow-through targets at $91,000 and $91,500. But until price clears that $88,000–$89,000 zone, rallies are at risk of being sold rather than chased. If BTC fails to reclaim resistance, the downside path is clear(h3) The near-term bear case is simple: if Bitcoin can’t climb back above the $87,000 area and keep traction, sellers may attempt another leg lower. Support levels line up like this: Immediate support: $85,500 First major support: $85,000 Next support: $83,500 Then $82,500 in the near term Below that, the major “don’t break this” level is still $80,000. If BTC slips under $80,000, the risk of acceleration to the downside increases significantly — not because it’s magic, but because it’s the kind of psychological and structural level that tends to trigger forced de-risking. Indicators: momentum still leans bearish(h3) The intraday indicators aren’t offering much comfort yet: Hourly MACD is losing pace in the bearish zone. Hourly RSI remains below 50, suggesting sellers still have the upper hand on short timeframes. So while the $85,000 defense held for now, the market hasn’t flipped bullish — it’s just stopped bleeding.
placeholder
AUD/USD remains depressed below mid-0.6600s; downside seems limited ahead of US NFP reportThe AUD/USD pair attracts some sellers for the fourth straight day on Tuesday and trades around the 0.6630 region, down just over 0.10%, during the Asian session.
Author  FXStreet
19 hours ago
The AUD/USD pair attracts some sellers for the fourth straight day on Tuesday and trades around the 0.6630 region, down just over 0.10%, during the Asian session.
placeholder
Macro Analysts: Hawkish Japan Could Push Bitcoin Below $70KAnalysts predict Bitcoin may face further declines towards the $70,000 mark if the Bank of Japan raises interest rates as expected.
Author  Mitrade
Yesterday 05: 48
Analysts predict Bitcoin may face further declines towards the $70,000 mark if the Bank of Japan raises interest rates as expected.
goTop
quote