


USD/CHF Price Forecast: Bulls eye 0.8200 as RSI turns higher
- USD/CHF holds near 0.8120 after Yen intervention speculation.
- RSI turns bullish, hinting at further upside in corrective trade.
- Break above 0.8156 exposes 0.8200 and yearly high.
The USD/CHF advances some 0.13% on Wednesday as the Greenback holds within familiar levels, after depreciating versus the Yen amid speculation of an intervention in the FX markets. This dragged the pair from around five-week highs to the 0.8120 area.
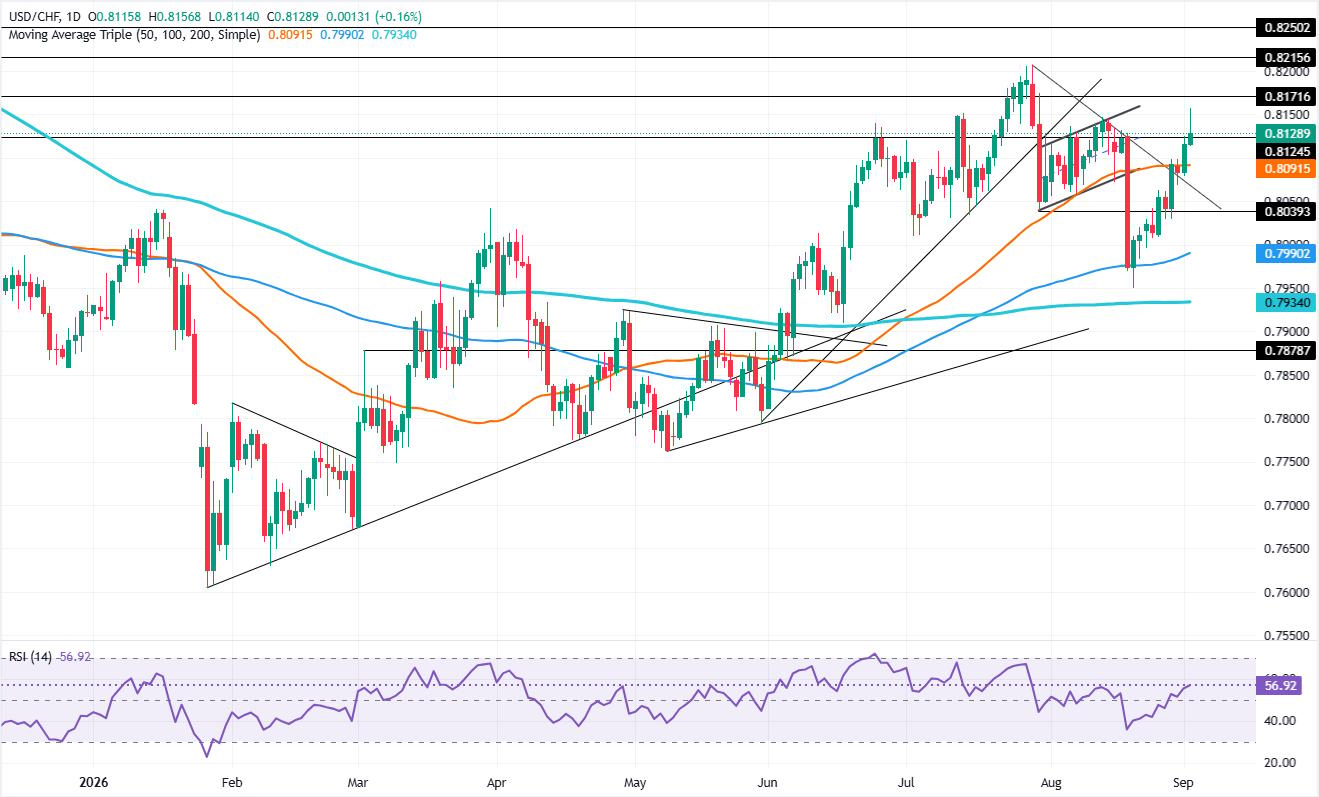
USD/CHF Price Forecast: Technical Outlook
Price action shows the USD/CHF is poised to trade sideways, after bouncing off a two-month low of 0.7949 on August 20, to current exchange rate levels. From a market structure perspective, the pair is on a corrective leg before extending the downtrend.
The Relative Strength Index (RSI) turned bullish, aiming higher and hinting at further upside.
For a bullish continuation, the USD/CHF must clear the high of the day (HOD) at 0.8156 ahead of challenging 0.8200. A decisive breakout will expose the current year high at 0.8207, followed by the psychological 0.8250 ahead of 0.8300.
On the other hand, if USD/CHF retreats to 0.8100, it opens the door for another lower leg. Below is the 50-day Simple Moving Average (SMA) at 0.8091, followed by the July 30 swing low of 0.8039. Once hurdled, the next stop is the 100-day SMA at 0.7990.
USD/CHF Price Chart – Daily
Swiss Franc Price Today
The table below shows the percentage change of Swiss Franc (CHF) against listed major currencies today. Swiss Franc was the strongest against the New Zealand Dollar.
| USD | EUR | GBP | JPY | CAD | AUD | NZD | CHF | |
|---|---|---|---|---|---|---|---|---|
| USD | 0.04% | 0.20% | -0.94% | -0.37% | -0.36% | 0.70% | 0.15% | |
| EUR | -0.04% | 0.16% | -0.97% | -0.41% | -0.39% | 0.65% | 0.11% | |
| GBP | -0.20% | -0.16% | -1.11% | -0.57% | -0.56% | 0.44% | -0.05% | |
| JPY | 0.94% | 0.97% | 1.11% | 0.56% | 0.57% | 1.63% | 1.08% | |
| CAD | 0.37% | 0.41% | 0.57% | -0.56% | 0.01% | 1.06% | 0.53% | |
| AUD | 0.36% | 0.39% | 0.56% | -0.57% | -0.01% | 1.02% | 0.53% | |
| NZD | -0.70% | -0.65% | -0.44% | -1.63% | -1.06% | -1.02% | -0.54% | |
| CHF | -0.15% | -0.11% | 0.05% | -1.08% | -0.53% | -0.53% | 0.54% |
The heat map shows percentage changes of major currencies against each other. The base currency is picked from the left column, while the quote currency is picked from the top row. For example, if you pick the Swiss Franc from the left column and move along the horizontal line to the US Dollar, the percentage change displayed in the box will represent CHF (base)/USD (quote).
Recommended Articles


