AUD/USD price Analysis: Volatility contracts amid Descending Triangle formation

Source Fxstreet
  • AUD/USD jumps to near 0.6650 ahead of US core PCE Inflation data.
  • The US Dollar weakens as a downwardly revised Q1 GDP keeps hopes of the Fed cutting rates at least once this year on the table.
  • Australia’s hot CPI report for April pushes back RBA’s rate-cut prospects.

The AUD/USD pair climbs to near 0.6650 in Friday’s London session. The Aussie asset strengthens as the US Dollar weakens ahead of United States core Personal Consumption Expenditure Price Index (PCE) data for April, which will be published at 12:30 GMT.

The US core PCE Inflation will provide cues about when the Federal Reserve (Fed) will start reducing interest rates. Currently, financial markets are mixed about September’s policy meeting.

Economists expect that core PCE inflation rose steadily by 0.3% and 2.8% monthly and annually, respectively.

The US Dollar Index (DXY) seems vulnerable near day’s low around 104.65. The near-term outlook of the US Dollar turned uncertain after US Bureau of Economic Analysis (BEA) reported its second estimates report for Q1 Gross Domestic Product (GDP) that the economy expanded at a slower pace of 1.3% due to lower consumer spendings from the preliminary estimates of 1.6%.

Meanwhile, the Australian Dollar’s appeal is upbeat as hot monthly Consumer Price Index (CPI) data for April has forced traders to pare Reserve Bank of Australia’s (RBA) early rate-cut bets. Annually, price pressures rose at a higher pace of 3.6% than estimates of 3.5% and the former reading of 3.4%.

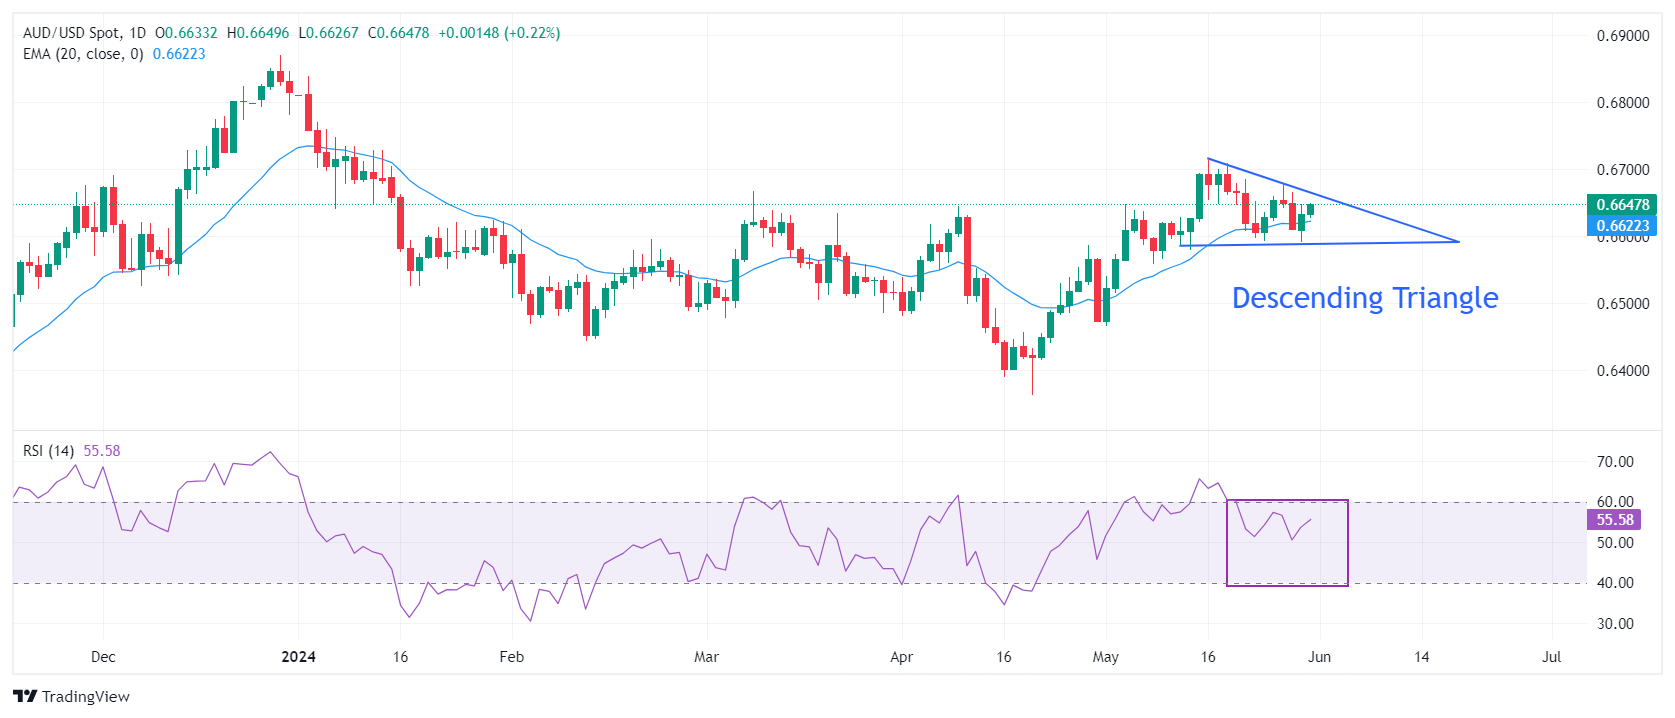
AUD/USD advances toward the downward-sloping border of the Descending Triangle chart pattern, which is plotted from May 16 high at 0.6714, formed on a daily timeframe. The horizontal support of the above-mentioned chart formation is marked from May 13 low at 0.6586.

Upward-sloping 20-day Exponential Moving Average (EMA) near 0.6620 suggests that the near-term trend is bullish.

The 14-period Relative Strength Index (RSI) oscillates in the 40.00-60.00 range, indicating a sharp volatility contraction.

Going forward, a decisive move above May’s high at 0.6714 will drive the asset towards January 3 high at 0.6771 and the round-level resistance of 0.6800.

Alternatively, a downside move would appear if the major breaks below May 14 low at 0.6580, which will expose it to May 1 high at 0.6540, followed by the psychological support of 0.6500.

AUD/USD daily chart
AUD/USD

Overview
Today last price 0.6647
Today Daily Change 0.0014
Today Daily Change % 0.21
Today daily open 0.6633
 
Trends
Daily SMA20 0.6633
Daily SMA50 0.6561
Daily SMA100 0.6559
Daily SMA200 0.6535
 
Levels
Previous Daily High 0.6647
Previous Daily Low 0.6591
Previous Weekly High 0.6709
Previous Weekly Low 0.6592
Previous Monthly High 0.6644
Previous Monthly Low 0.6362
Daily Fibonacci 38.2% 0.6626
Daily Fibonacci 61.8% 0.6612
Daily Pivot Point S1 0.66
Daily Pivot Point S2 0.6567
Daily Pivot Point S3 0.6543
Daily Pivot Point R1 0.6657
Daily Pivot Point R2 0.668
Daily Pivot Point R3 0.6713


Disclaimer: For information purposes only. Past performance is not indicative of future results.
placeholder
Top 3 Price Prediction: Bitcoin, Ethereum, Ripple – BTC, ETH and XRP Look for a Foothold After a Sharp ShakeoutBitcoin trades near $92,600 after a dip below $90,000, while Ethereum around $3,118 and XRP near $2.21–$2.23 sit on key support zones, as BTC, ETH and XRP all try to turn a sharp correction into a tradable rebound rather than a deeper slide.
Author  Mitrade
Nov 19, Wed
Bitcoin trades near $92,600 after a dip below $90,000, while Ethereum around $3,118 and XRP near $2.21–$2.23 sit on key support zones, as BTC, ETH and XRP all try to turn a sharp correction into a tradable rebound rather than a deeper slide.
placeholder
Even As Bitcoin's Price Falls, Michael Saylor Feels 'Indestructible'The price of Bitcoin dipped below $89,000, setting a new weekly low as corporate buyer Strategy remains bullish.
Author  Mitrade
Yesterday 03: 08
The price of Bitcoin dipped below $89,000, setting a new weekly low as corporate buyer Strategy remains bullish.
placeholder
Could XRP Really Catch Ethereum? Analysts Revisit the Question as ETF Tailwinds BuildAs US spot XRP ETFs roll out and issuers like Canary Capital and Franklin Templeton step in, analysts say XRP’s market cap could climb on growing utility and ETF accumulation—but overtaking Ethereum’s $373 billion smart-contract powerhouse remains a long-shot, at least for now.
Author  Mitrade
Yesterday 03: 28
As US spot XRP ETFs roll out and issuers like Canary Capital and Franklin Templeton step in, analysts say XRP’s market cap could climb on growing utility and ETF accumulation—but overtaking Ethereum’s $373 billion smart-contract powerhouse remains a long-shot, at least for now.
placeholder
Bitcoin's Drop to $86K Approaches 'Max Pain' Zone, Yet Presents Potential Buying OpportunityAnalysts identify the $84,000 to $73,000 range as Bitcoin's likely "max pain" territory where capitulation may occur.
Author  Mitrade
2 hours ago
Analysts identify the $84,000 to $73,000 range as Bitcoin's likely "max pain" territory where capitulation may occur.
placeholder
Market Meltdown: BTC, ETH, and XRP Capitulate as Bears Seize ControlBitcoin trades around $85,900 after breaking below $86,000, with Ethereum under $2,791 and XRP below $1.99 as BTC, ETH and XRP extend weekly losses of 8–10%, forcing traders to focus on supports at $85,000, $2,749 and $1.77 for clues on whether this sell-off has further to run.
Author  Mitrade
2 hours ago
Bitcoin trades around $85,900 after breaking below $86,000, with Ethereum under $2,791 and XRP below $1.99 as BTC, ETH and XRP extend weekly losses of 8–10%, forcing traders to focus on supports at $85,000, $2,749 and $1.77 for clues on whether this sell-off has further to run.
goTop
quote