

AUD/USD begins Thursday’s session flat ahead of RBA Hunter speech

Source Fxstreet
  • AUD/USD declines to 0.6608 as US Treasury yields climb amid soft bond demand.
  • Mixed regional Fed surveys and hawkish remarks from Fed’s Kashkari impact market sentiment.
  • Australian CPI rises to 3.6% YoY in April; analysts expect rate cuts starting in November.

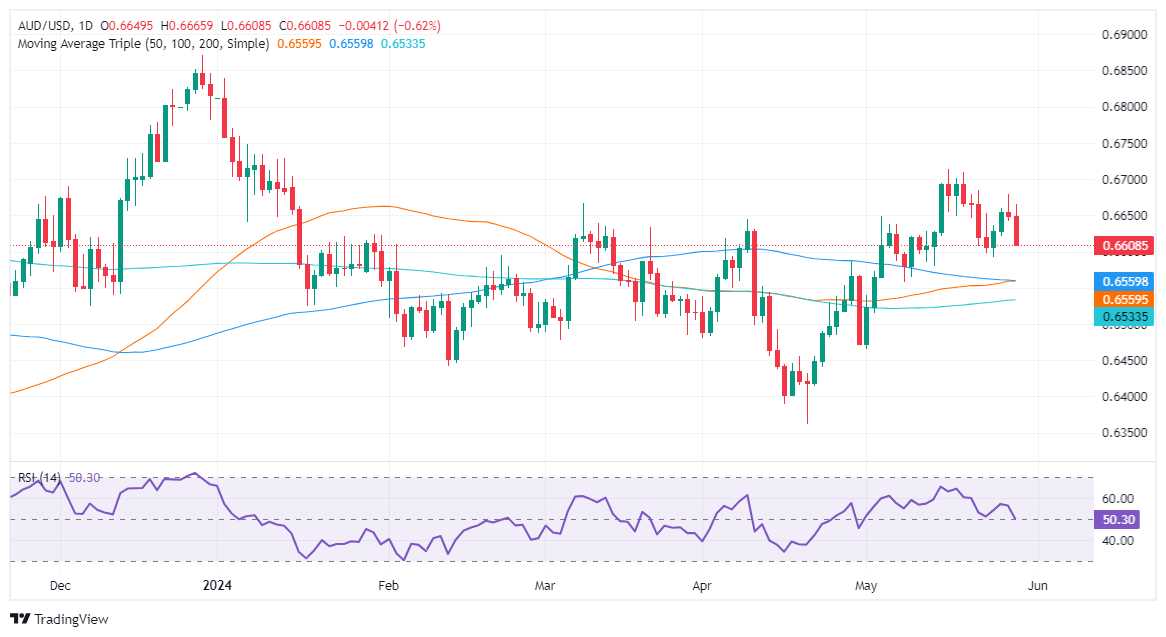
The Aussie Dollar tumbled more than 0.50% on Wednesday versus the Greenback amid elevated US Treasury yields, as another bond auction witnessed softer demand. A scarce economic docket in the United States (US) featured the release of regional Fed surveys, which were mixed. The AUD/USD trades at 0.6608, almost flat as Thursday’s Asian session commences.

AUD/USD falls towards 0.6600 on hawkish Fed comments, high US yields

Sentiment remains sour as Wall Street ended Wednesday's session in the red. Investors were rattled by Tuesday’s uber-hawkish tilt of Minneapolis Fed President Neel Kashkari, who commented that rate hikes are not off the table. When questioned about lowering interest rates, he said that he expects no more than two cuts.

Meanwhile, data from the Chicago Board of Trade (CBOT) shows that investors had priced in 25 basis points of rate cuts in 2024, according to December’s 2024 fed funds future contract.

Data-wise, the US economic schedule featured regional Fed activity surveys index for May, which were mixed. The Richmond Fed Manufacturing Index improved to 0, from a -7 plunge in the last print. The Dallas Fed Services Index weakened to -12.1, worse than April’s -10 contraction.

On the Aussie’s front, the monthly Consumer Price Index (CPI) rose to a five-month high of 3.6% YoY in April, up from 3.5% in March. According to ANZ analysts, “Disinflation in underlying inflation measures has also stalled. Our forecast for a November start to cash rate cuts is unchanged, although risks remain tilted towards a later start.”

The economic docket in Australia will feature a speech by Reserve Bank of Australia (RBA) Assistant Governor Sarah Hunter and data on Building Permits.

AUD/USD Price Analysis: Technical outlook

Despite remaining bullish-biased, the AUD/USD seems poised for a pullback if buyers fail to defend 0.6600. Momentum shows that sellers are stepping in, as the Relative Strength Index (RSI) pierced below the 50-midline. This could pave the way for increased selling pressure, driving prices lower.

In that event, key support levels emerge. The confluence of the 50- and 100-day moving averages (DMAs) is at around 0.6558/59, followed by the 200-DMA at 0.6531. Conversely, if buyers keep spot prices above 0.6600, if they gather traction, the pair could aim towards 0.6650.
Australian Dollar PRICE This week

The table below shows the percentage change of Australian Dollar (AUD) against listed major currencies this week. Australian Dollar was the strongest against the Euro.

  USD EUR GBP JPY CAD AUD NZD CHF
USD   0.43% 0.32% 0.41% 0.39% 0.30% 0.03% -0.16%
EUR -0.43%   -0.14% 0.00% -0.05% -0.19% -0.49% -0.54%
GBP -0.32% 0.14%   0.08% 0.07% -0.04% -0.28% -0.43%
JPY -0.41% 0.00% -0.08%   -0.05% -0.12% -0.29% -0.58%
CAD -0.39% 0.05% -0.07% 0.05%   -0.10% -0.36% -0.59%
AUD -0.30% 0.19% 0.04% 0.12% 0.10%   -0.22% -0.39%
NZD -0.03% 0.49% 0.28% 0.29% 0.36% 0.22%   -0.18%
CHF 0.16% 0.54% 0.43% 0.58% 0.59% 0.39% 0.18%  

The heat map shows percentage changes of major currencies against each other. The base currency is picked from the left column, while the quote currency is picked from the top row. For example, if you pick the Australian Dollar from the left column and move along the horizontal line to the US Dollar, the percentage change displayed in the box will represent AUD (base)/USD (quote).


Disclaimer: For information purposes only. Past performance is not indicative of future results.
placeholder
Fed hike odds near 90% into Wednesday's decision — how to trade the dollar, gold and the S&P 500A 0.3% monthly core CPI print has lifted the market-implied probability of a 25bp Fed hike on 16 September to roughly 86.5% ~ 90%, which would be the first increase since July 2023. Here is the decision timeline, the pricing versus the forecasts, both scenarios, and the key levels for the dollar, gold and the S&P 500.
Author  Suzie
Sep 14, Mon
A 0.3% monthly core CPI print has lifted the market-implied probability of a 25bp Fed hike on 16 September to roughly 86.5% ~ 90%, which would be the first increase since July 2023. Here is the decision timeline, the pricing versus the forecasts, both scenarios, and the key levels for the dollar, gold and the S&P 500.
placeholder
【Daily Brief】10-year Treasury yield briefly tops 5%, S&P 500 slips to 7,602 and the dollar firms at 99.3 as the Fed's decision eve beginsThe 10-year Treasury yield touched 5.014% on Monday — its first print above 5% since October 2023 — while the S&P 500 closed 0.48% lower at 7,619.98 and the dollar index firmed to 99.3. Here is the full market wrap ahead of Wednesday's FOMC decision, the dot plot and the August retail sales report, plus today's CLARITY Act Senate vote.
Author  Irene Q.
Sep 15, Tue
The 10-year Treasury yield touched 5.014% on Monday — its first print above 5% since October 2023 — while the S&P 500 closed 0.48% lower at 7,619.98 and the dollar index firmed to 99.3. Here is the full market wrap ahead of Wednesday's FOMC decision, the dot plot and the August retail sales report, plus today's CLARITY Act Senate vote.
placeholder
Silver breaks $64 as precious metals rebound — can gold hold the $4,280 line into the Fed decision?Silver has climbed back above $64 an ounce for the first time this week, leading a broad rebound across precious metals hours before the Federal Reserve delivers what is expected to be its first rate hike since 2023. Spot silver was last at $64.64, up 1.49% on the day, while gold reclaimed $4,300 and platinum and palladium both advanced. The question now is whether the bounce is a genuine turn — or a pause before the Fed's dot plot decides the next move.
Author  Suzie
Yesterday 08: 40
Silver has climbed back above $64 an ounce for the first time this week, leading a broad rebound across precious metals hours before the Federal Reserve delivers what is expected to be its first rate hike since 2023. Spot silver was last at $64.64, up 1.49% on the day, while gold reclaimed $4,300 and platinum and palladium both advanced. The question now is whether the bounce is a genuine turn — or a pause before the Fed's dot plot decides the next move.
placeholder
Bitcoin falls below $75,000 as the CLARITY Act fails in the Senate — what the vote means for cryptoThe US Senate blocked the Digital Asset Market CLARITY Act in a 49-50 procedural vote, sending Bitcoin briefly below $75,000 — its biggest one-day drop since June. Ethereum fell more than 8%, Coinbase slid 10% and $75 billion of crypto market value evaporated. Here is what the vote was, why it failed, and the levels that matter now.
Author  Suzie
Yesterday 08: 47
The US Senate blocked the Digital Asset Market CLARITY Act in a 49-50 procedural vote, sending Bitcoin briefly below $75,000 — its biggest one-day drop since June. Ethereum fell more than 8%, Coinbase slid 10% and $75 billion of crypto market value evaporated. Here is what the vote was, why it failed, and the levels that matter now.
placeholder
Dollar index tops 100 for the first time since July as the Fed's hawkish dot plot sinks inThe U.S. dollar index broke back above 100 for the first time since 31 July after the Fed delivered its first rate hike since 2023, with the dot plot showing 16 of 18 officials expect at least one more increase this year. Here are the levels that matter for DXY, the currencies feeling it most, and what to watch next.
Author  Irene Q.
8 hours ago
The U.S. dollar index broke back above 100 for the first time since 31 July after the Fed delivered its first rate hike since 2023, with the dot plot showing 16 of 18 officials expect at least one more increase this year. Here are the levels that matter for DXY, the currencies feeling it most, and what to watch next.
Related Instrument
goTop
quote