


Stellar’s RWA Value Nears $1 Billion – Will XLM Price Turn Bullish?
Stellar price has struggled for months and remains down about 34% over the past three months. Despite this broader downtrend, recent price action has stabilized, with XLM trading mostly flat over the past 24 hours. Under the surface, several signals suggest the weakness may be losing strength rather than accelerating.
At the same time, Stellar’s real usage is growing. Capital continues flowing into the network, dip buying remains active, and a bullish chart structure is forming. With Stellar’s real-world asset value now nearing $1 billion, the price is approaching a key decision point.
A Bullish Price Pattern Forms as Real Usage Grows
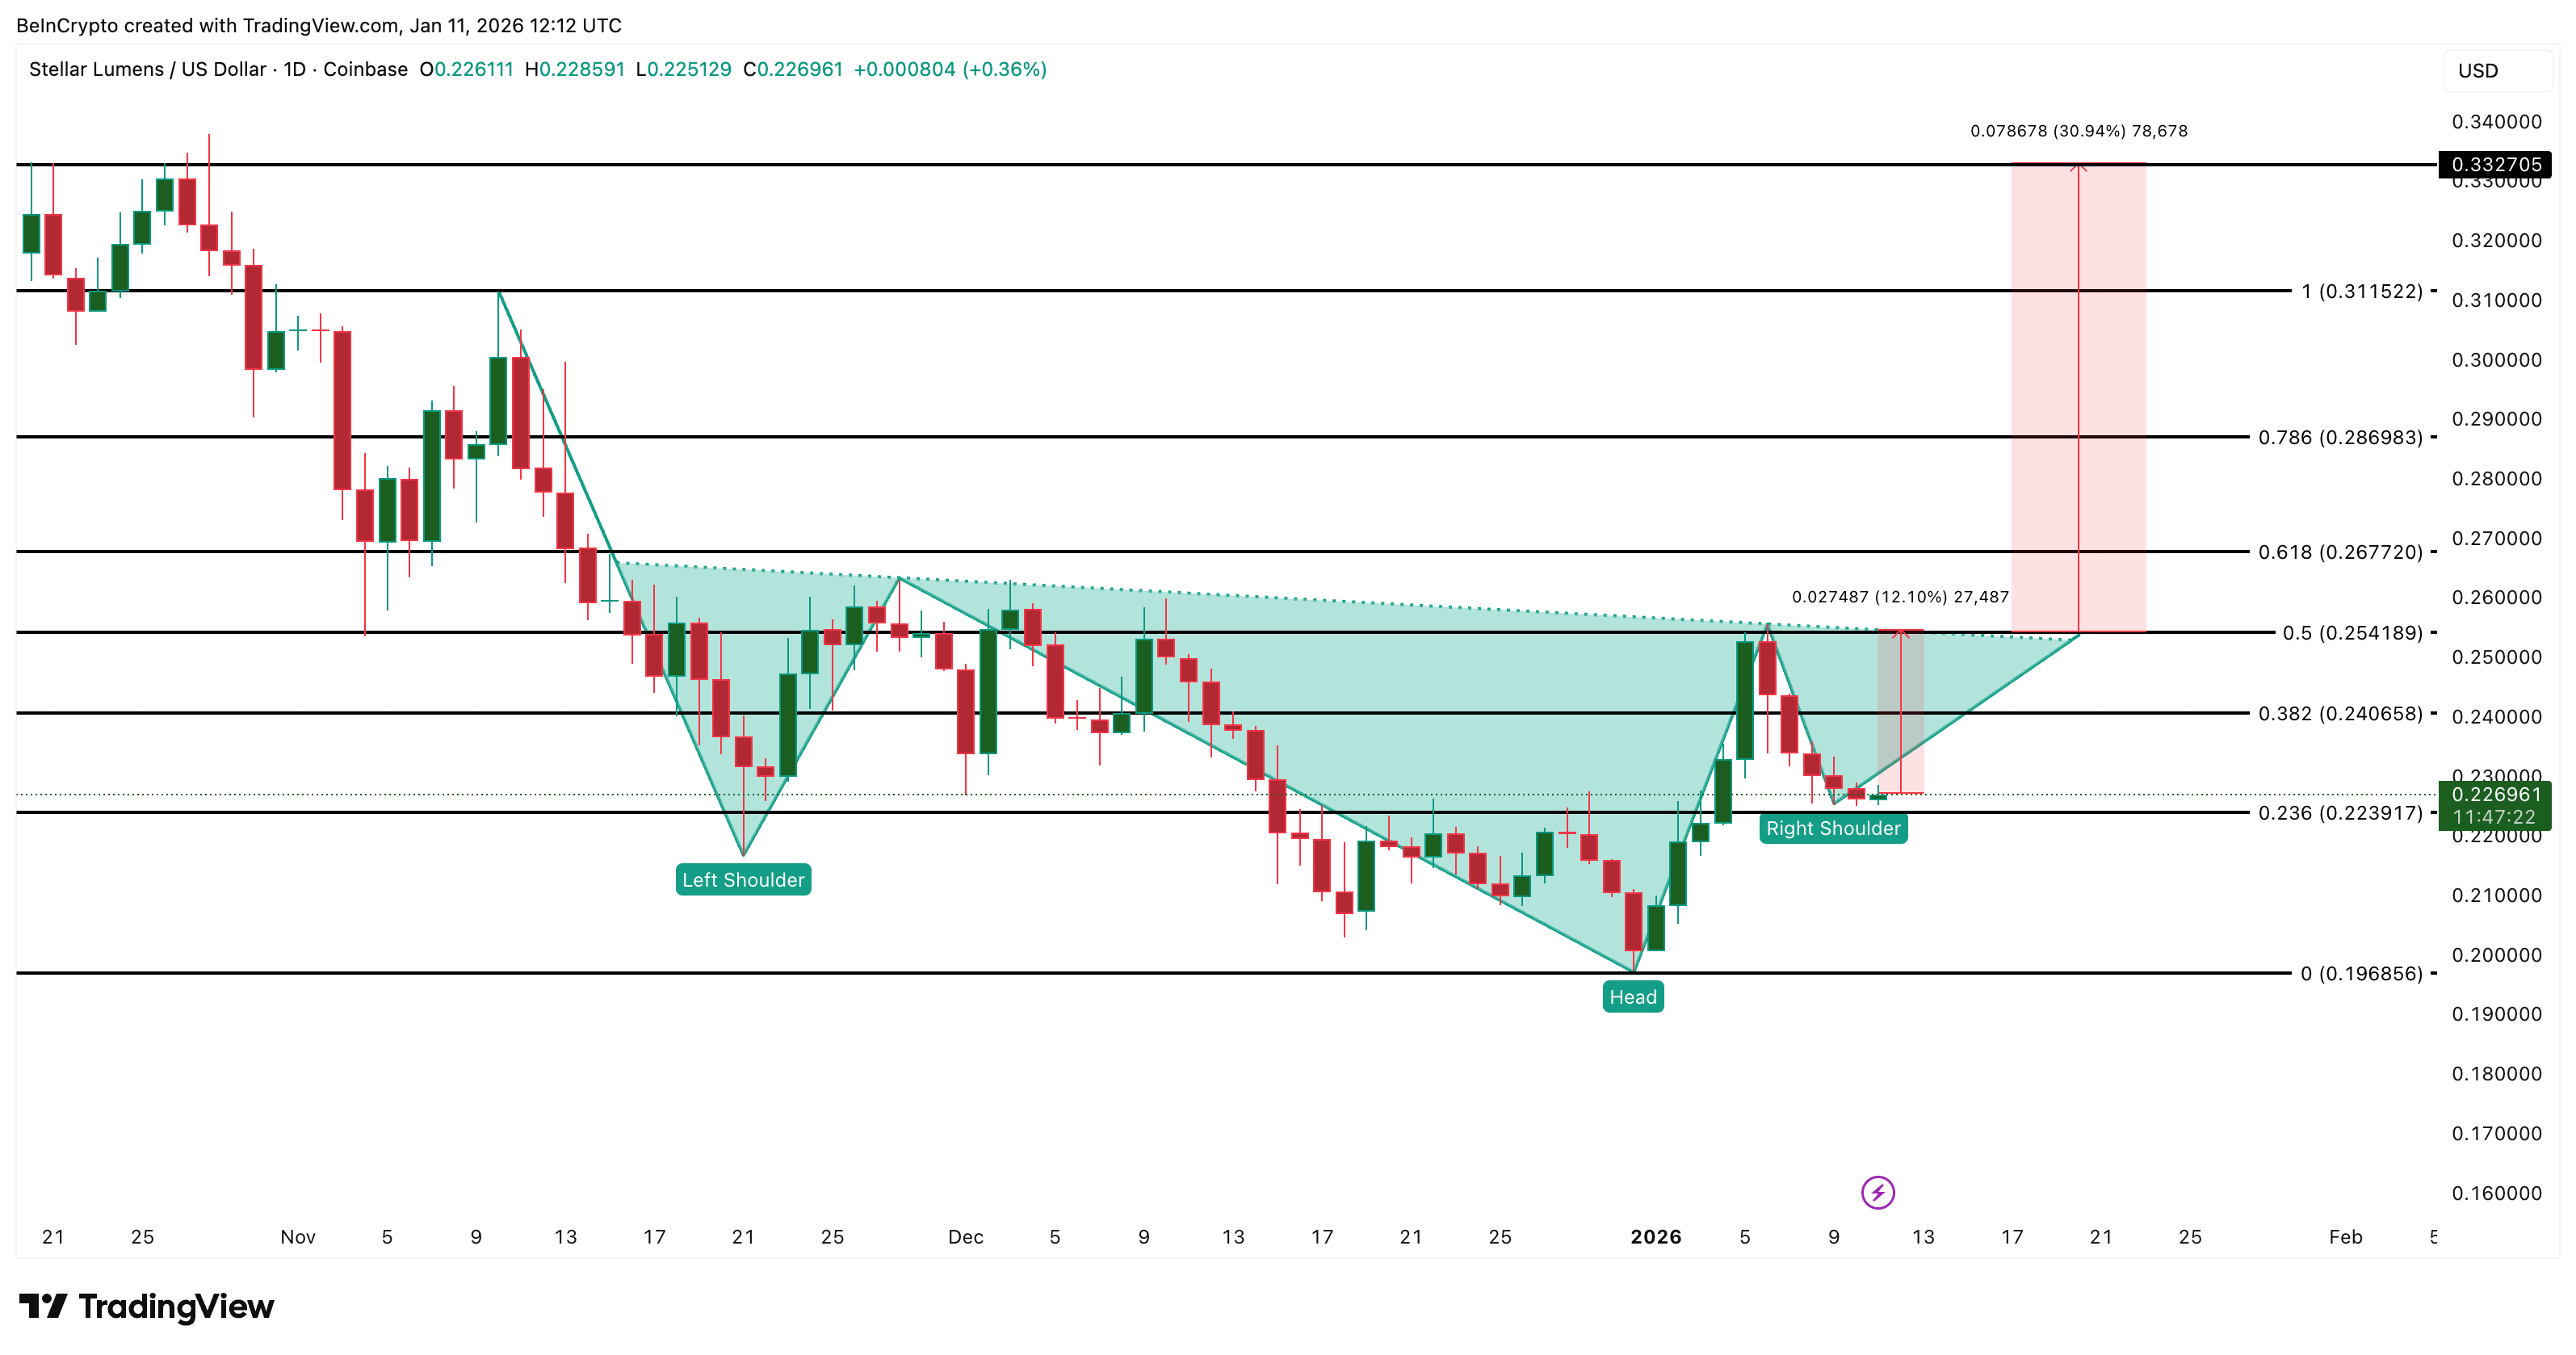
Stellar is forming an inverse head and shoulders pattern on the daily chart, a structure that often appears near market bottoms. The pattern shows that selling pressure is gradually fading while buyers step in earlier on each decline. The left shoulder formed in November, the head printed in late December, and the recent pullback created the right shoulder.
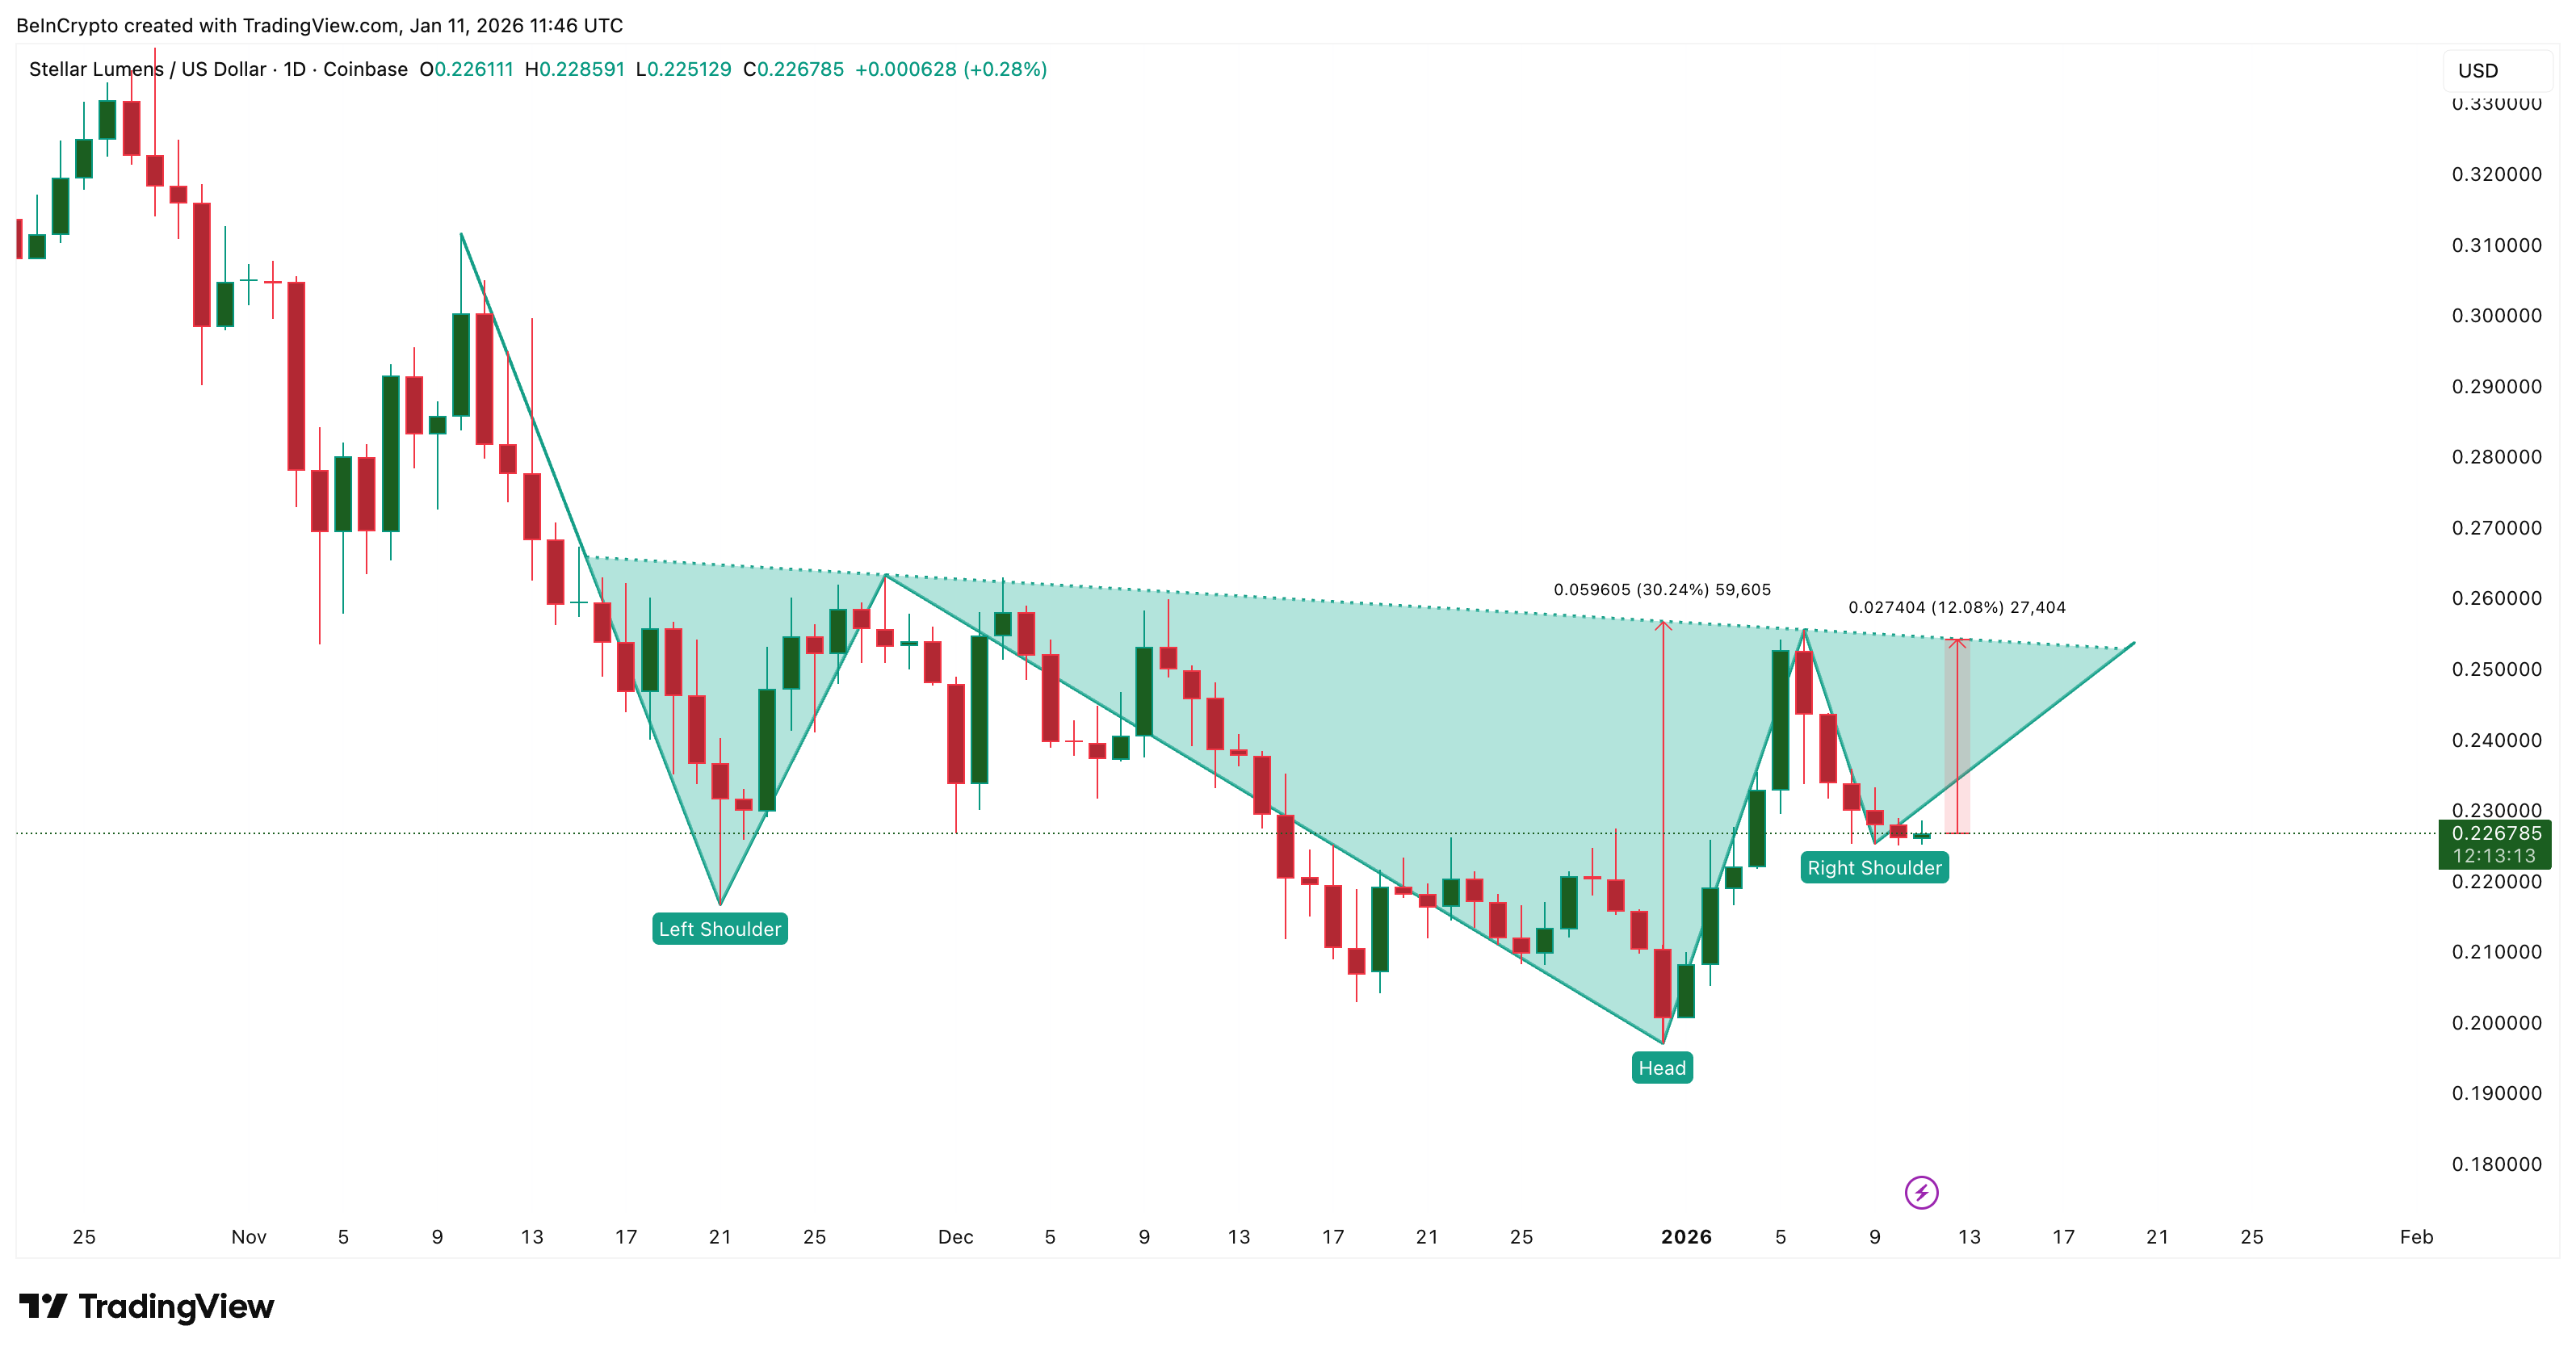 Stellar’s Bullish Pattern: TradingView
Want more token insights like this? Sign up for Editor Harsh Notariya’s Daily Crypto Newsletter here.
This structure began taking shape after December 31, when Stellar rallied nearly 30% before correcting between January 6 and January 9. That correction did not break the trend.
Instead, it helped shape the right shoulder. The neckline of the pattern sits roughly 12% above the current price. A daily close above this level would confirm the breakout.
What strengthens this setup is real network growth. Stellar’s real-world asset value rose from about $890 million (on December 31) to roughly $986 million in early January. That is an increase of around 10.8% in just a short period, bringing the network close to the $1 billion mark.
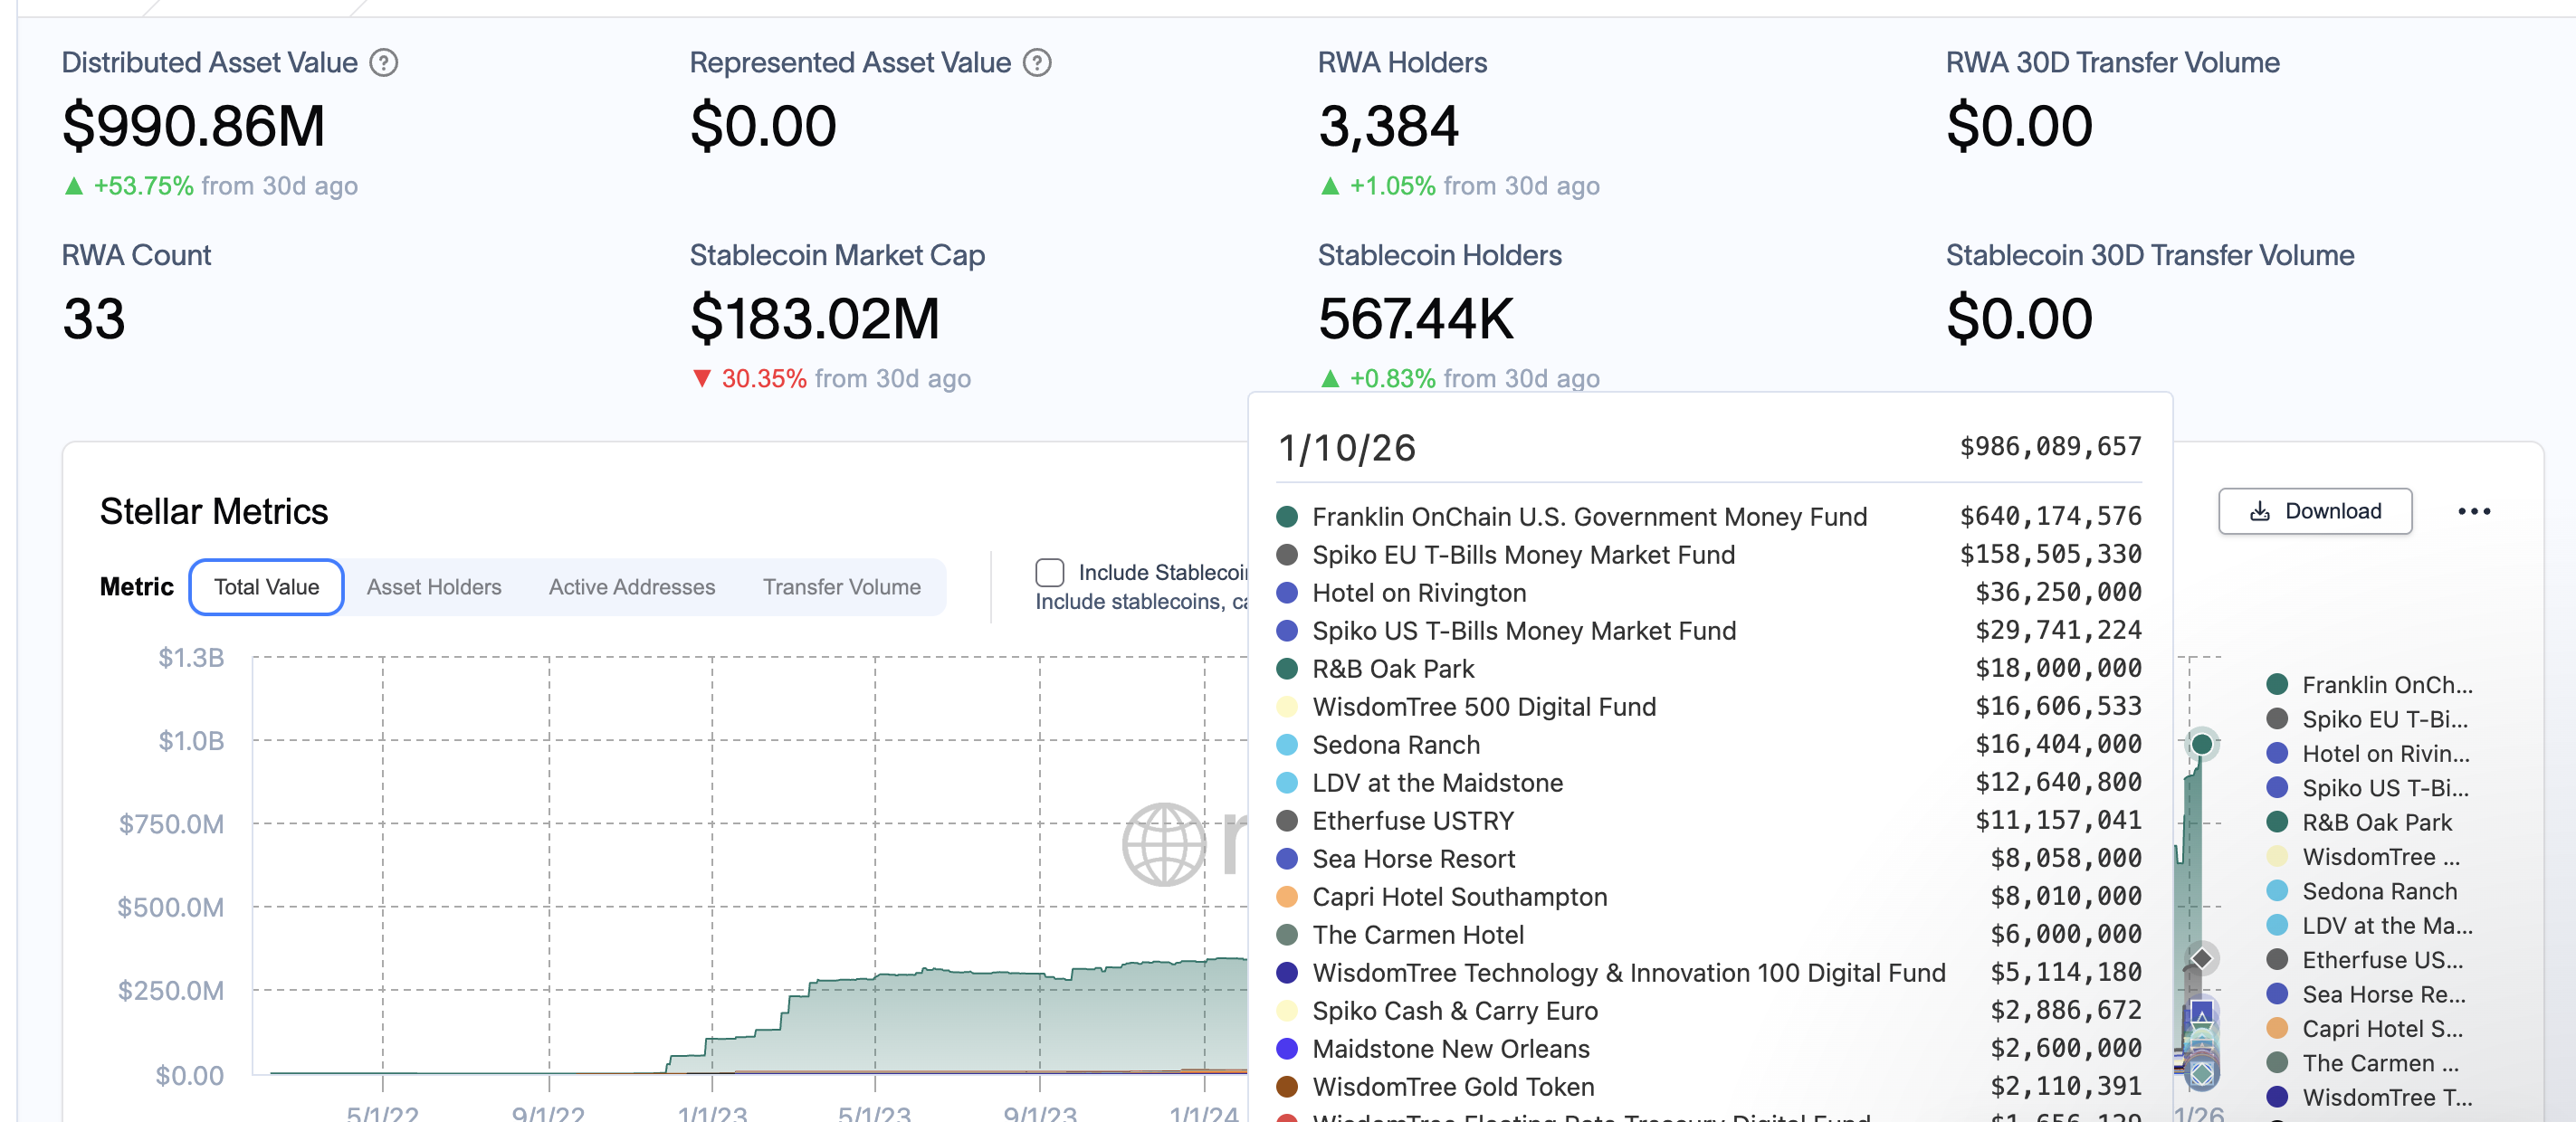 RWA Value Grows: RWA.XYZ
This rise in usage helps explain why the price stabilized instead of breaking down, giving the bullish pattern a solid foundation.
Capital Inflows and Dip Buying Support the Structure
To understand why the pattern is holding, it helps to look at capital flows. Chaikin Money Flow, or CMF, measures whether money is entering or leaving an asset.
When CMF stays above zero, it shows that more capital is flowing in than flowing out. For Stellar, CMF has remained positive even while the price moved lower over recent weeks.
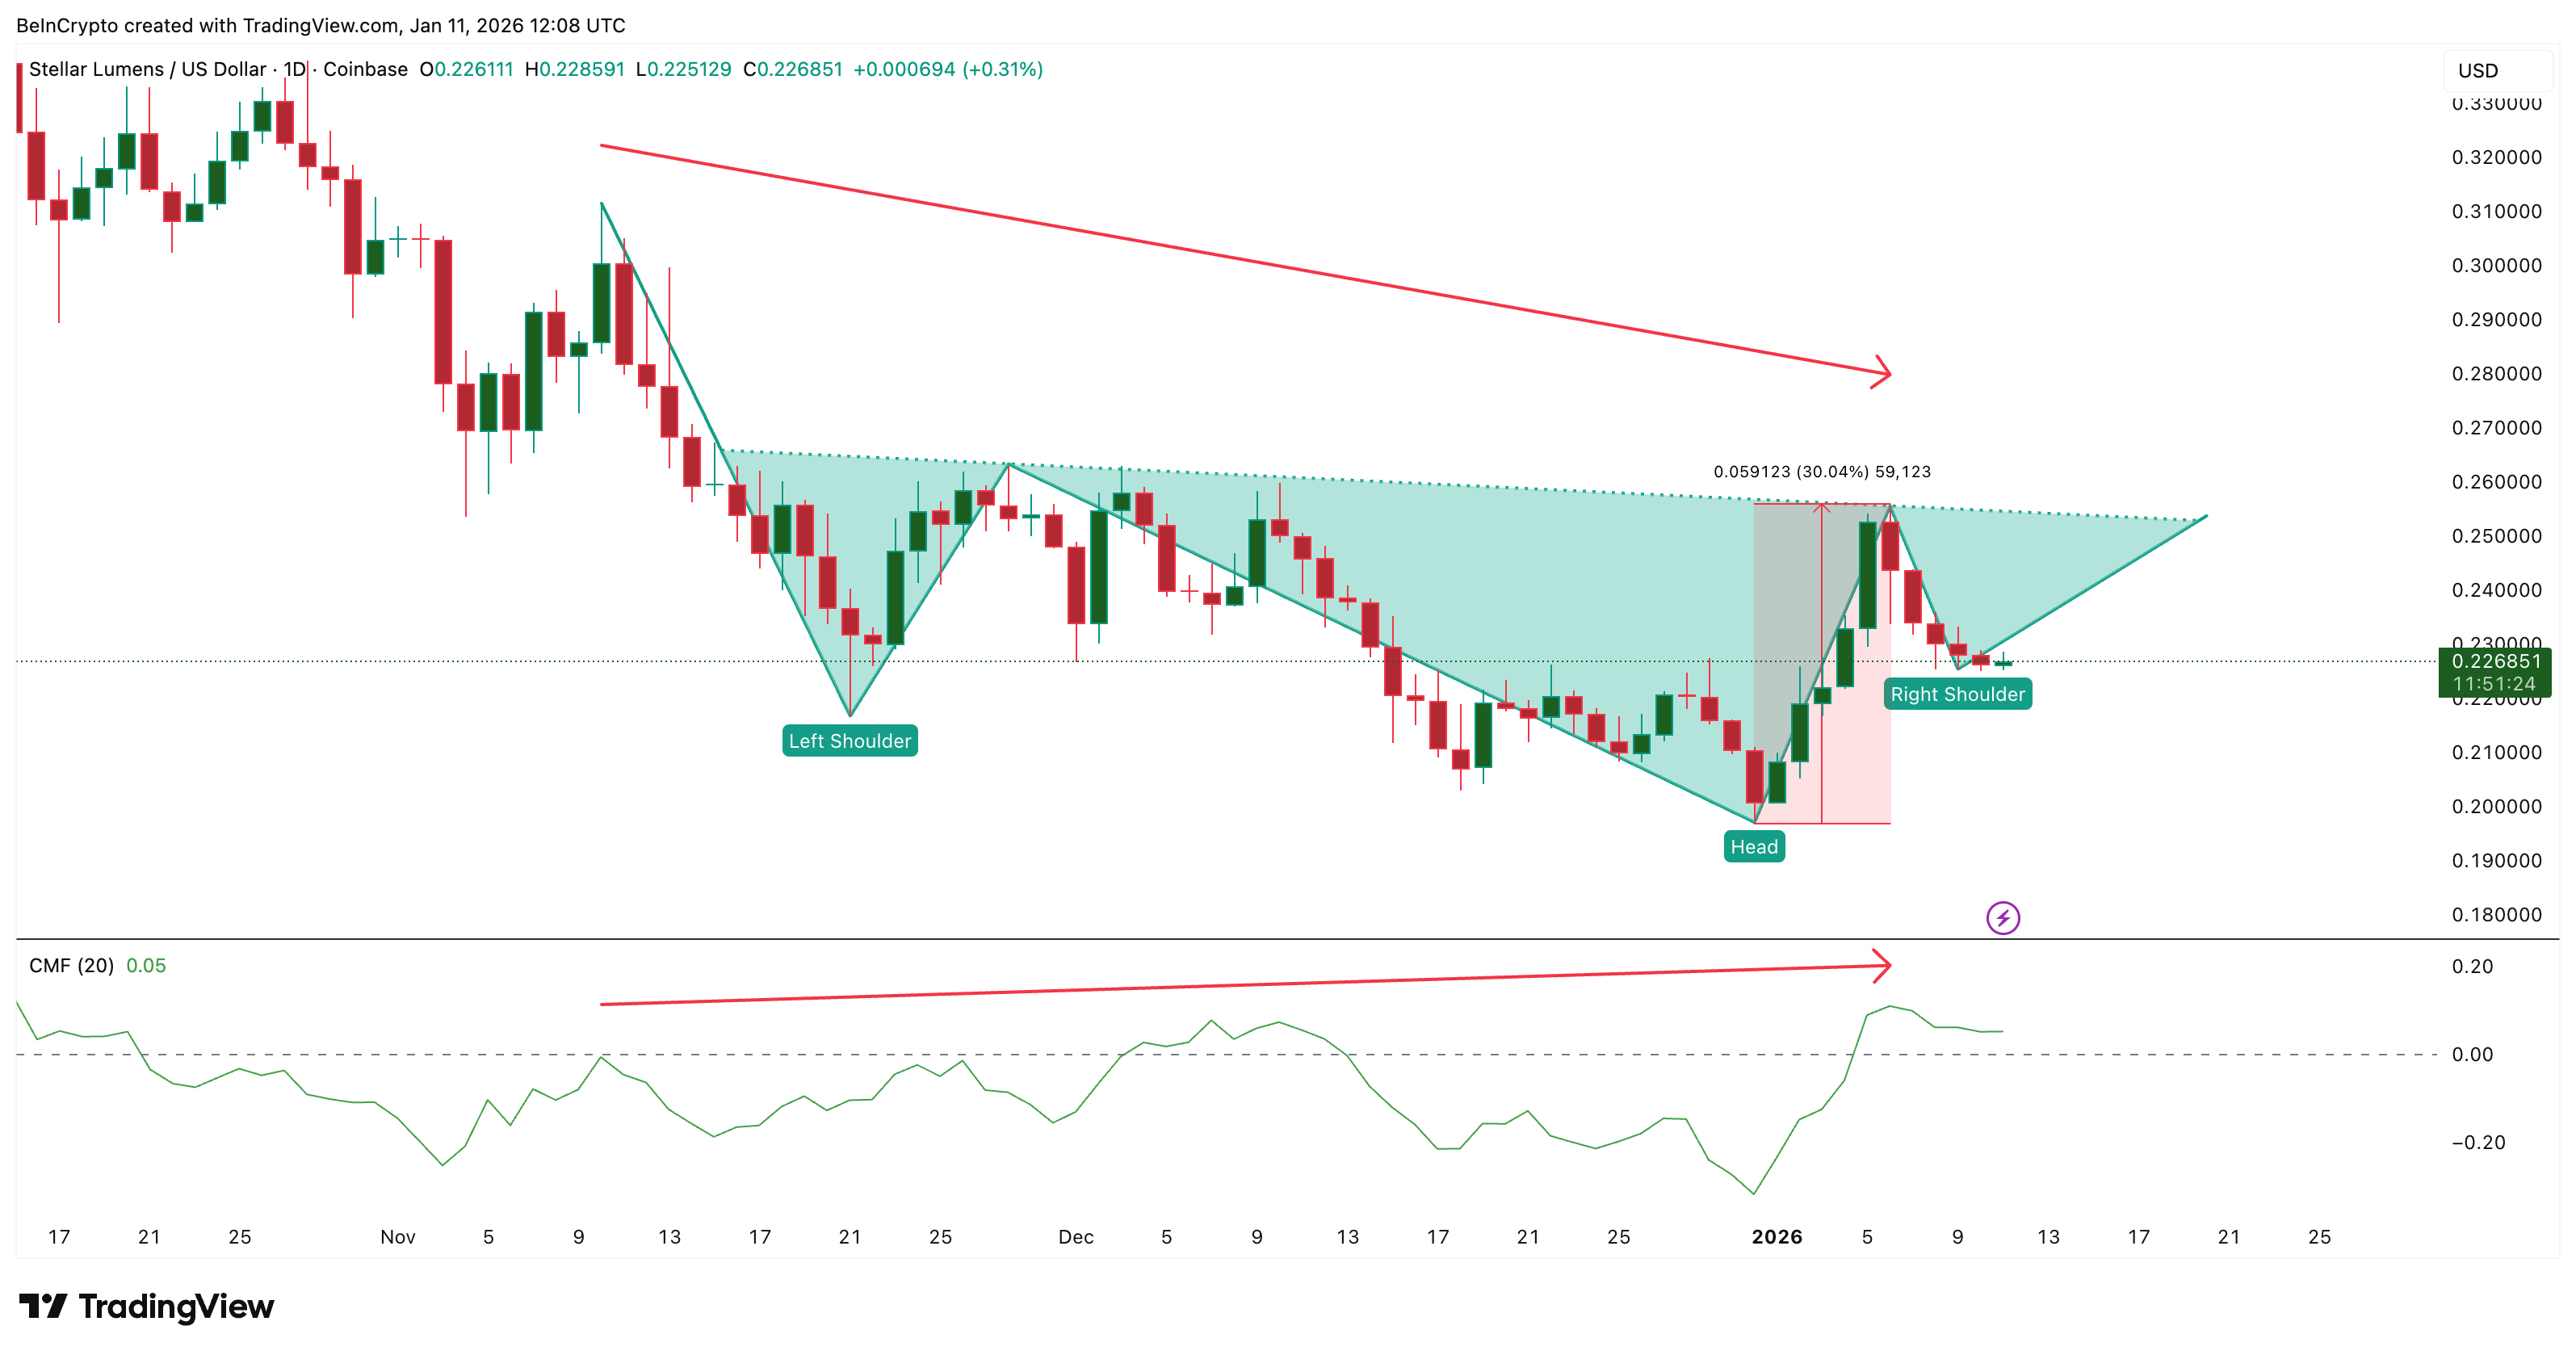 Large Capital Flow Continues: TradingView
This signals steady capital inflows rather than distribution. That behavior lines up closely with the rise in Stellar’s real-world asset value. Capital flowing into the network is also showing up in price data, suggesting large participants are building positions during weakness.
Dip buying also remains visible through the Money Flow Index, or MFI. MFI tracks buying and selling pressure using both price and volume. Between late November and late December, the Stellar price made lower lows. During the same period, MFI held higher levels and continued rising. This shows buyers consistently stepping in on dips rather than abandoning positions.
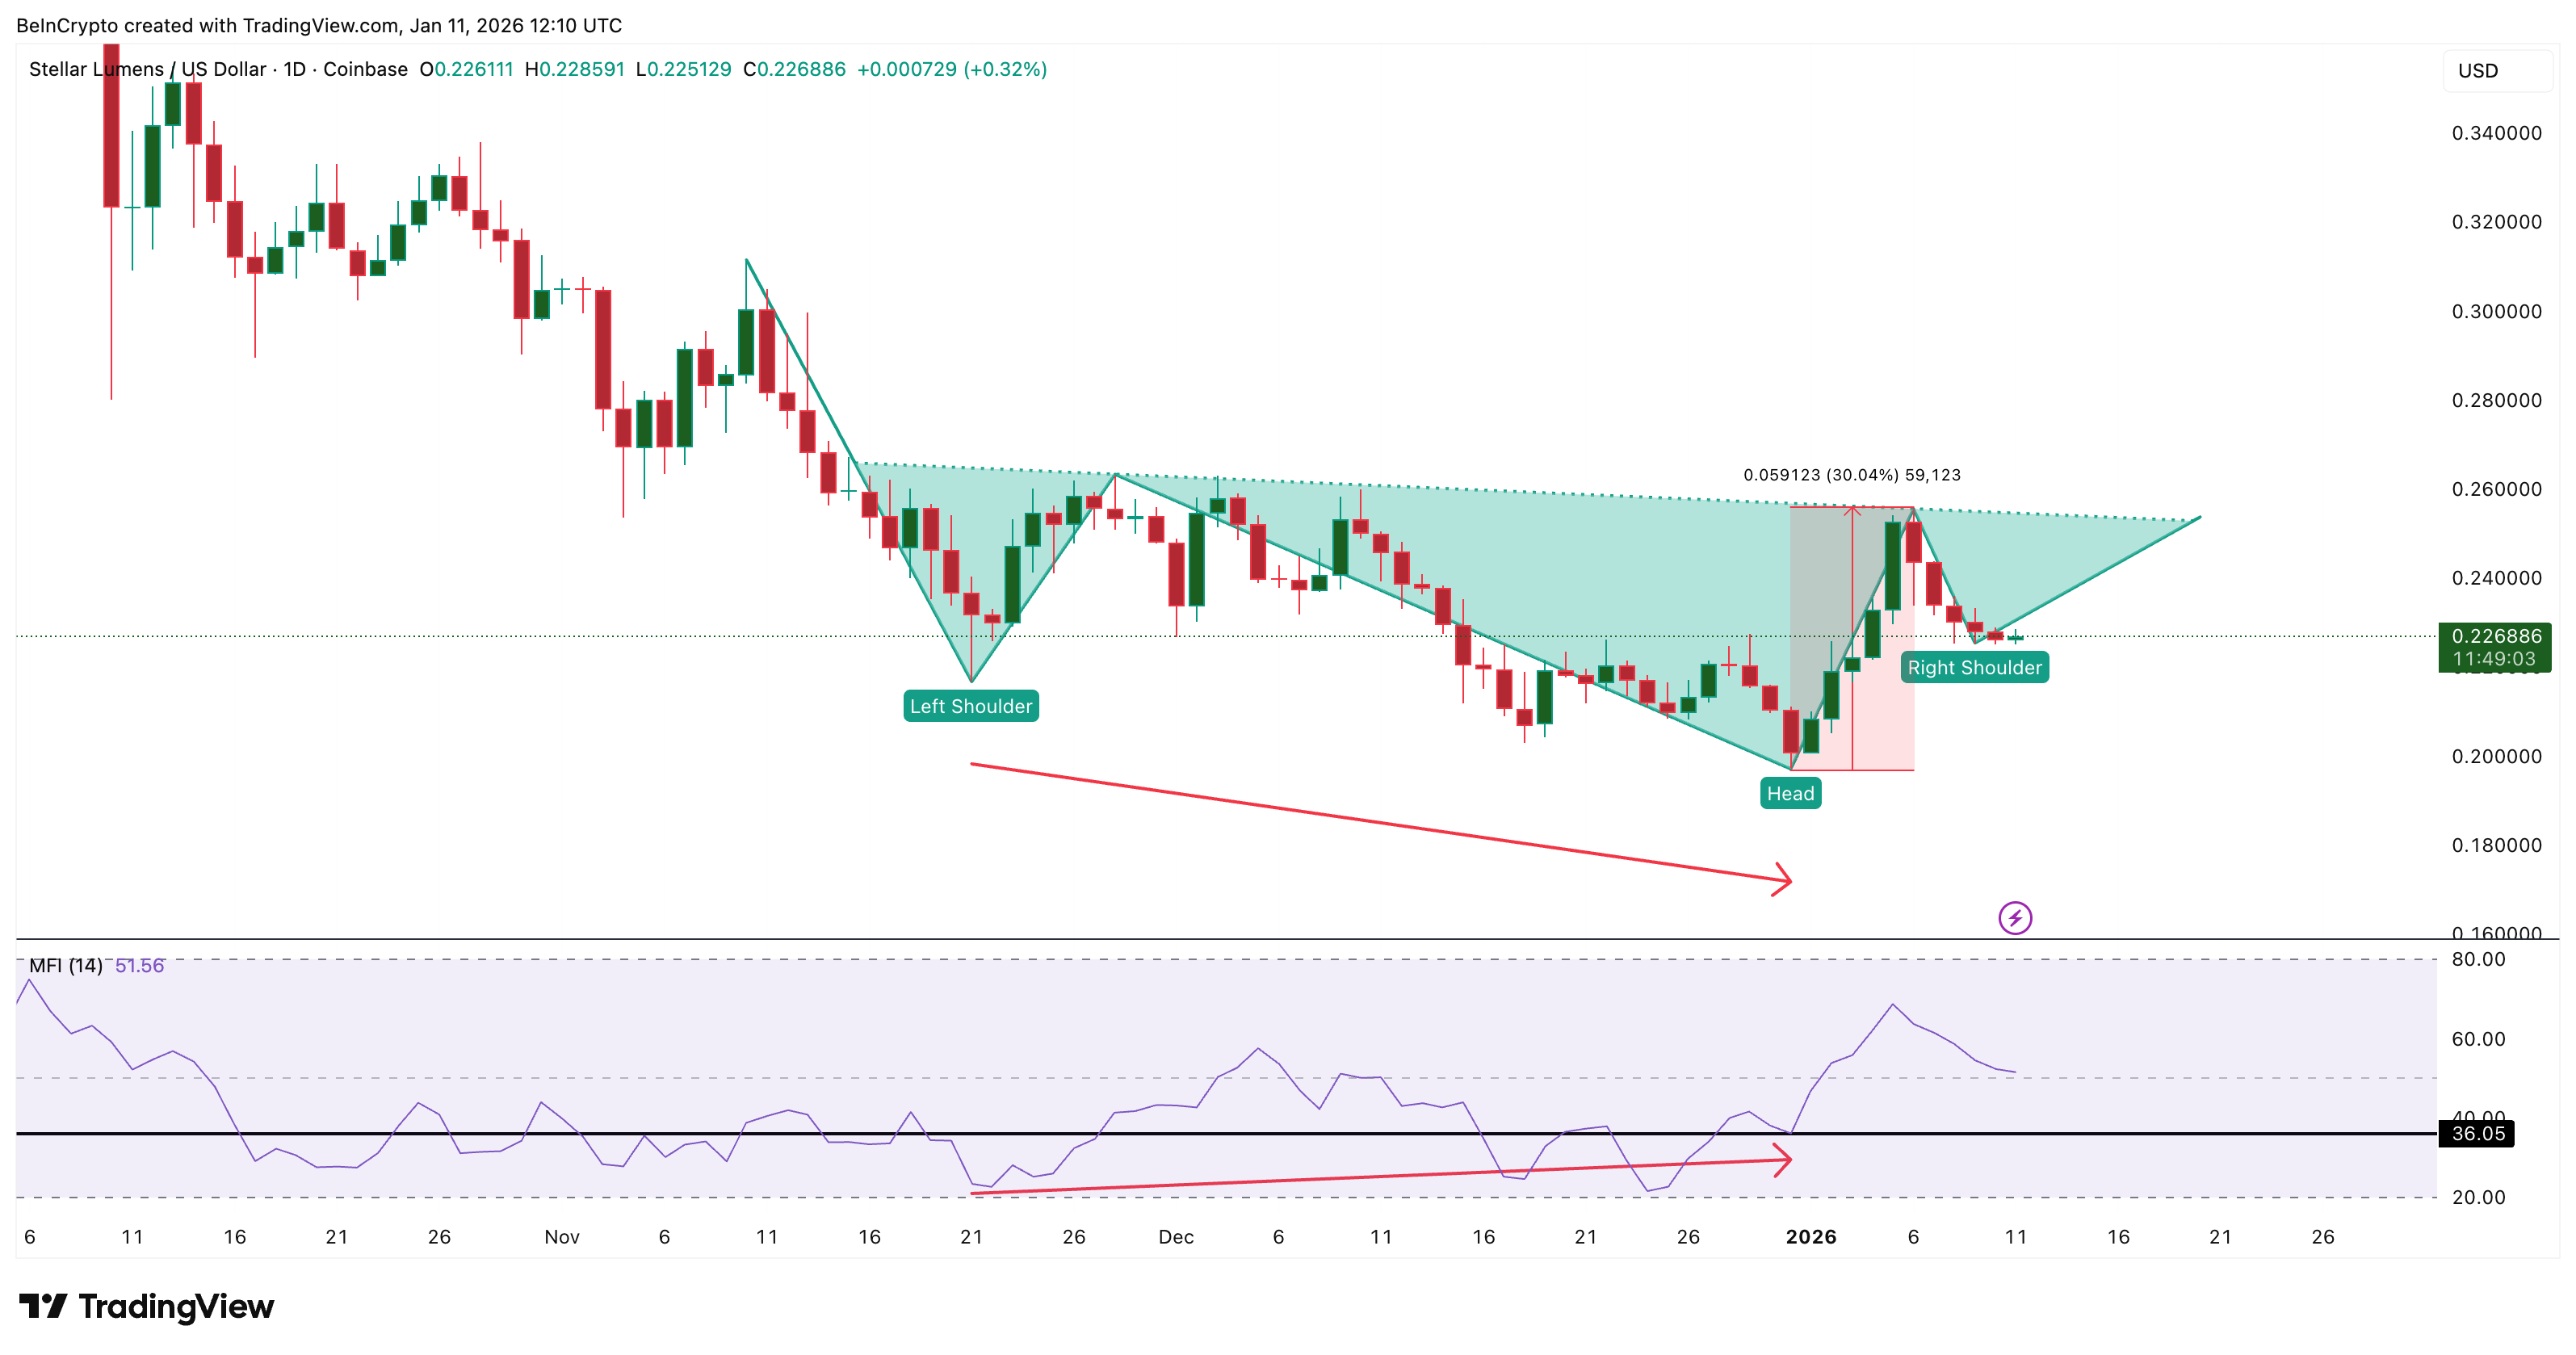 Dip Buying Continues: TradingView
As long as MFI remains above the 36 level, this dip-buying behavior stays intact. Buyers are still absorbing selling pressure, which helps support the right shoulder of the pattern.
Levels That Decide Whether Stellar Price Breaks Higher
The technical Stellar price levels ahead are well defined. A daily close above $0.254 (the 12% theory established earlier) would confirm the inverse head and shoulders breakout and open the path toward the $0.330 area, which represents the projected 30% upside from the neckline.
On the downside, $0.223 is the first level to watch. A daily close below it would weaken the bullish structure. A deeper close below $0.196 would invalidate the pattern entirely by breaking below the head.
 Stellar Price Analysis: TradingView
For now, the Stellar price is compressed between steady capital inflows, active dip buying, and a clear breakout level overhead. Usage on the network continues to grow, even as price hesitates. Whether XLM moves higher now depends on one question: can price catch up to the capital already flowing into Stellar’s network?
Recommended Articles


