


NZD/USD Price Analysis: Surrenders majority of hawkish RBNZ-induced gains
- NZD/USD retreats to 0.6100 but still holds hawkish RBNZ-inspired gains.
- The RBNZ said the decision on rate cuts will be delayed amid headwinds of persistent price pressures.
- Investors await the FOMC minutes to project the next move in the US Dollar.
The NZD/USD pair falls sharply to near the crucial support of 0.6100 in Wednesday’s European session. Earlier, the Kiwi asset rose vertically to 0.6150 after the Reserve Bank of New Zealand (RBNZ) delivered a hawkish interest rate outlook post keeping its Official Cash Rate (OCR) steady at 5.5% for the seventh time in a row.
The New Zealand Dollar still holds significant gains against the US Dollar amid firm speculation that the RBNZ will start reducing interest rates later than the Federal Reserve (Fed). In the press conference, RBNZ Governor Adrian Orr cautioned a potential delay in interest rate cuts due to sticky price pressures. In the monetary policy statement, the RBNZ commented that inflation is expected to return to the 1%-3% band by the year-end.
Meanwhile, the US Dollar Index (DXY) rises to 104.70 ahead of the release of the Federal Open Market Committee (FOMC) that will provide more cues on United States interest rate path. The US Dollar remains well-supported above 104.40 from last few trading sessions as Fed officials continue supporting for interest rates remaining at their current levels for a longer period.
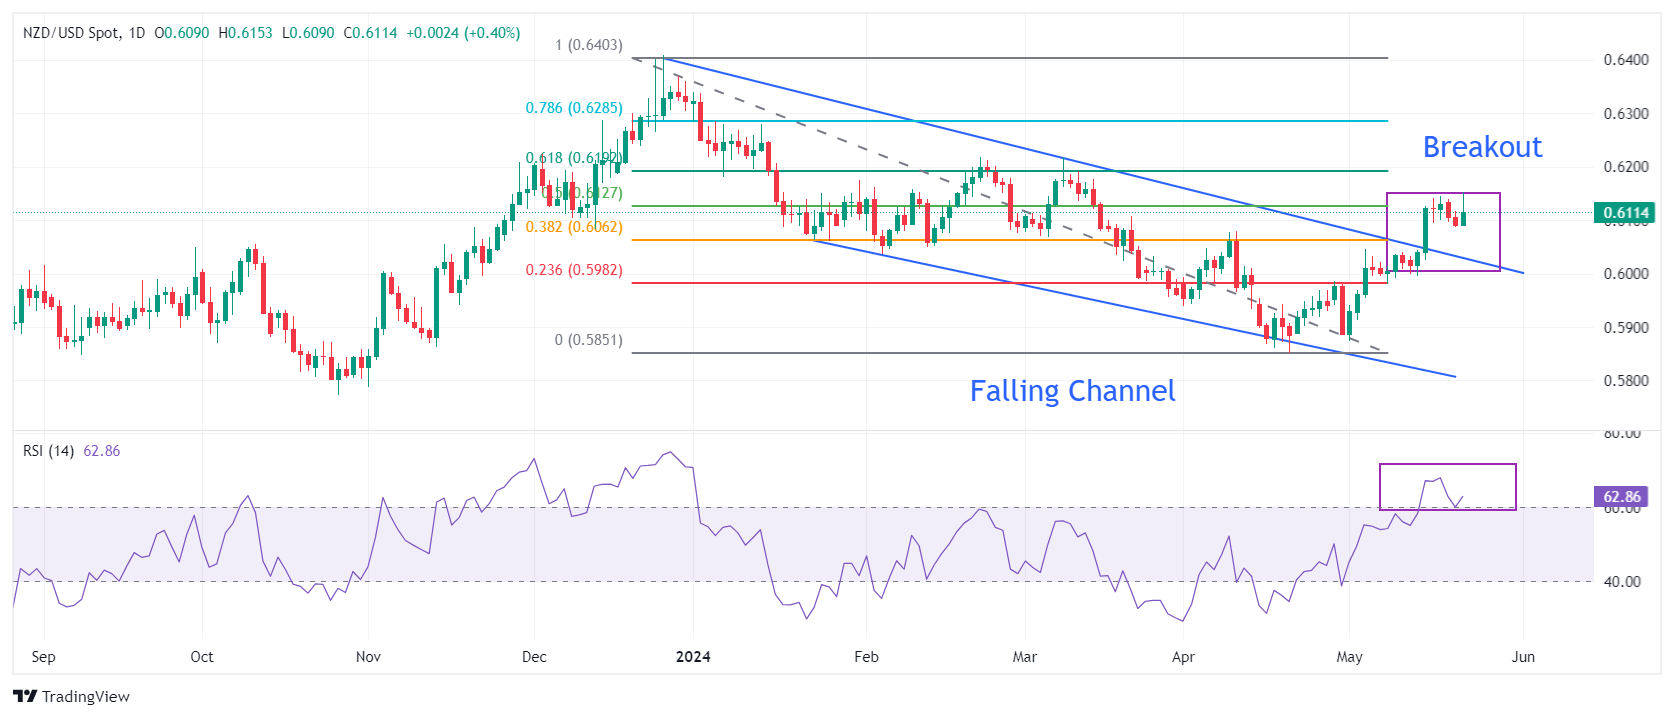
NZD/USD remains firm after a breakout of the Falling Channel formation on a daily timeframe. The Kiwi asset extends recovery to 50% Fibonacci retracement (plotted from December 26 high at 0.6410 to April 19 low around 0.5850) at 0.6130.
The 14-period Relative Strength Index (RSI) has shifted comfortably into the bullish range of 60.00-80.00, suggesting that the momentum has leaned toward the upside.
An upside move above February 9 high of 0.6160 will drive the asset towards 61.8% Fibo retracement at 0.6200, followed by January 15 high near 0.6250
On the contrary, fresh downside would appear if the asset breaks below April 4 high around 0.6050 This would drag the asset towards the psychological support of 0.6000 and April 25 high at 0.5969.
NZD/USD daily chart
Economic Indicator
RBNZ Interest Rate Decision
The Reserve Bank of New Zealand (RBNZ) announces its interest rate decision after its seven scheduled annual policy meetings. If the RBNZ is hawkish and sees inflationary pressures rising, it raises the Official Cash Rate (OCR) to bring inflation down. This is positive for the New Zealand Dollar (NZD) since higher interest rates attract more capital inflows. Likewise, if it reaches the view that inflation is too low it lowers the OCR, which tends to weaken NZD.
Read more.Last release: Wed May 22, 2024 02:00
Frequency: Irregular
Actual: 5.5%
Consensus: 5.5%
Previous: 5.5%
Source: Reserve Bank of New Zealand
The Reserve Bank of New Zealand (RBNZ) holds monetary policy meetings seven times a year, announcing their decision on interest rates and the economic assessments that influenced their decision. The central bank offers clues on the economic outlook and future policy path, which are of high relevance for the NZD valuation. Positive economic developments and upbeat outlook could lead the RBNZ to tighten the policy by hiking interest rates, which tends to be NZD bullish. The policy announcements are usually followed by Governor Adrian Orr’s press conference.
Recommended Articles


