


USD/INR finds some support amid modest US Dollar recovery
- Indian Rupee edges lower amid renewed USD demand on Tuesday.
- The ongoing Indian equity outflows might weigh on the INR.
- Speeches by Fed’s Waller, Williams, Barr, Bostic, Collins, and Mester will be closely watched on Tuesday.
Indian Rupee (INR) loses traction on Tuesday on the modest rebound of US Dollar (USD). Analysts believe that a continuation of equity outflows might exert some selling pressure on the INR and limit the pair’s downside. Traders will keep an eye on foreign outflows, as overseas investors have mostly been on the sell side since the beginning of the fiscal year.
On the other hand, the prospect of rate cuts this year from the US Federal Reserve (Fed) after softer US April inflation data weighs on the USD and US bond yields. Additionally, the Greenback sales by state-run banks, possibly on behalf of the Reserve Bank of India (RBI), might boost the local currency in the near term. The Indian FX and debt markets will be closed on Thursday. Meanwhile, traders will take more cues from the remarks by Fed officials. Apart from this, India's national election outcome will be due on June 4, and exit polls will be released after the final phase of the elections on June 1.
Daily Digest Market Movers: Indian Rupee weakens amid equity outflows
- Foreign investors have sold Indian equities worth more than $3 billion in May, the largest monthly outflow since January 2023.
- Bond yields are expected to decline as India announced that it will reduce the supply of Treasury bills by 600 billion rupees for the next six weeks till the end of June, per Reuters.
- According to India Ratings and Research's lead economist, Sunil Kumar Sinha, India's GDP growth rate for the March quarter is expected to grow 6.7%, with about 6.9-7% for the fiscal year 2023–24.
- The United Nations (UN) has revised India’s growth projections for 2024 to 6.9% this year from 6.2% projected in January. Indian economy is forecast to expand by 6.6% in 2025.
- Financial markets have priced in a 76% possibility of a rate cut from the Fed by 25 basis points (bps) in September and two cuts by the end of the year, according to the CME FedWatch Tool.
Technical analysis: USD/INR maintains a constructive stance
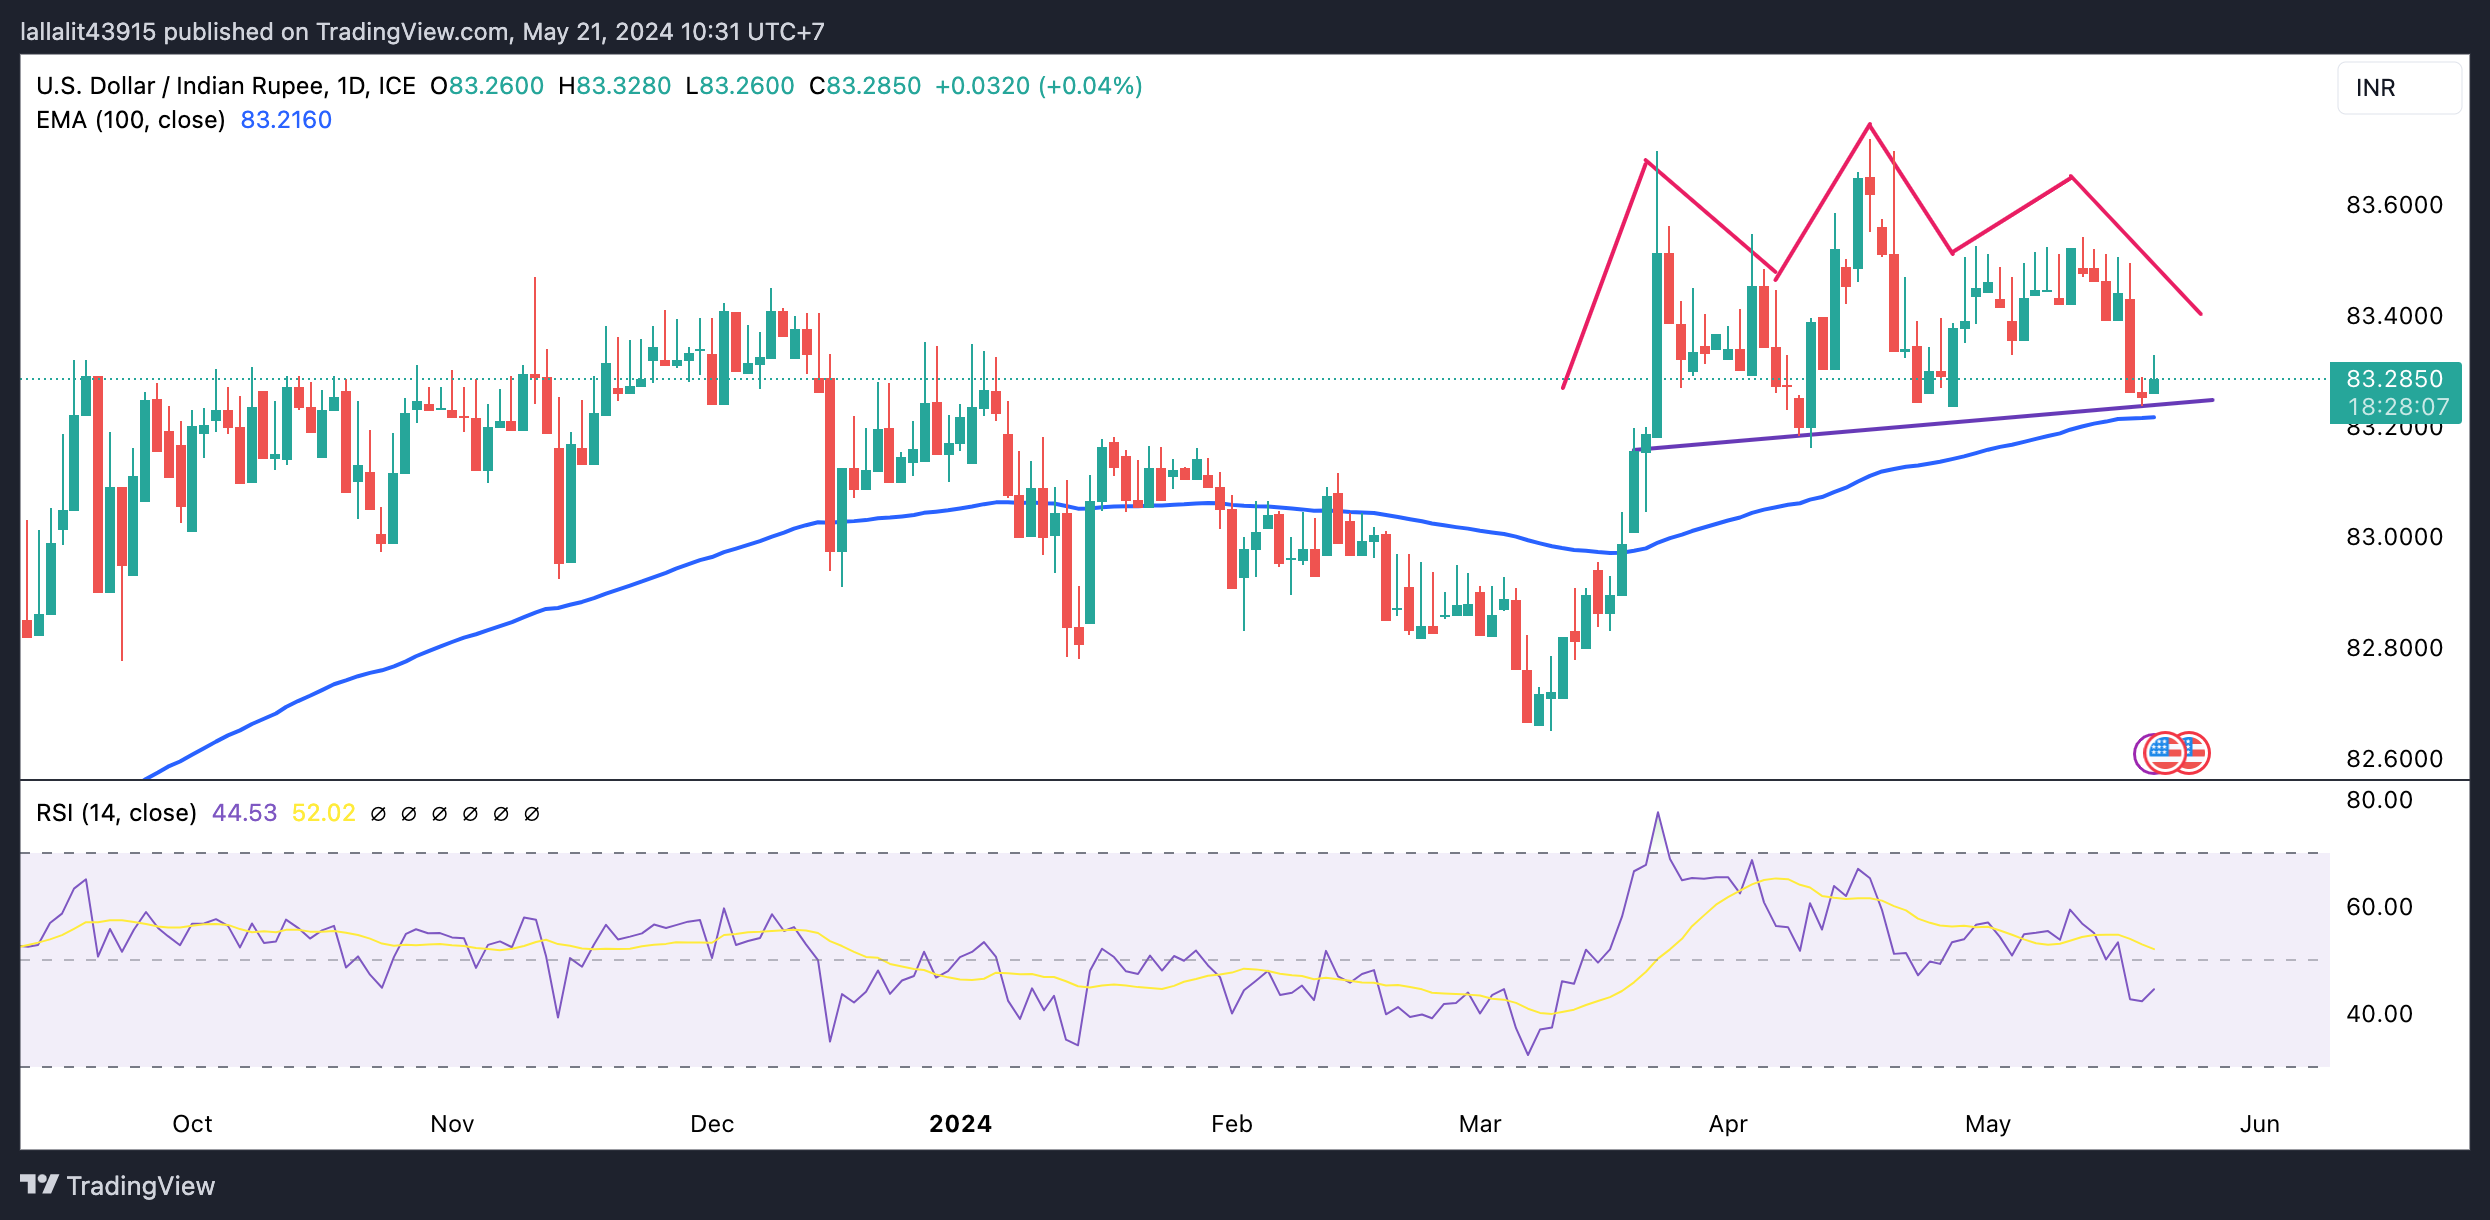
The Indian Rupee trades on a weaker note on the day. The bullish outlook of USD/INR remains unchanged as the pair is above the key 100-day Exponential Moving Average (EMA) on the daily chart. However, the bearish bias could resume if the pair crosses below the key EMA and the neckline of the Head and Shoulders pattern, which has formed since March 21. The 14-day Relative Strength Index (RSI) holds in bearish territory around 47.30, suggesting that further downside cannot be ruled out.
The first upside barrier for USD/INR will emerge near the right shoulder of 83.54 (high of May 13). A break above this level would end up invalidating the Head and Shoulders pattern. The next hurdle is seen near a high of April 17 at 83.72.
On the flip side, the key support level is located at the 83.20–83.25 region, portraying the confluence of the neckline and the 100-day EMA. A breach of the mentioned level will see a drop to the 83.00 psychological level, followed by a low of January 15 at 82.78.
US Dollar price today
The table below shows the percentage change of US Dollar (USD) against listed major currencies today. US Dollar was the strongest against the .
| USD | EUR | GBP | CAD | AUD | JPY | NZD | CHF | |
| USD | 0.05% | 0.03% | 0.12% | 0.28% | 0.06% | 0.21% | 0.11% | |
| EUR | -0.05% | -0.01% | 0.07% | 0.22% | 0.00% | 0.17% | 0.05% | |
| GBP | -0.04% | 0.01% | 0.08% | 0.23% | 0.01% | 0.18% | 0.06% | |
| CAD | -0.12% | -0.09% | -0.07% | 0.15% | -0.06% | 0.10% | -0.03% | |
| AUD | -0.29% | -0.23% | -0.25% | -0.16% | -0.22% | -0.07% | -0.18% | |
| JPY | -0.07% | -0.01% | 0.00% | 0.08% | 0.22% | 0.16% | 0.05% | |
| NZD | -0.21% | -0.17% | -0.18% | -0.09% | 0.07% | -0.15% | -0.09% | |
| CHF | -0.11% | -0.05% | -0.07% | 0.02% | 0.17% | -0.05% | 0.11% |
The heat map shows percentage changes of major currencies against each other. The base currency is picked from the left column, while the quote currency is picked from the top row. For example, if you pick the Euro from the left column and move along the horizontal line to the Japanese Yen, the percentage change displayed in the box will represent EUR (base)/JPY (quote).
Indian Rupee FAQs
The Indian Rupee (INR) is one of the most sensitive currencies to external factors. The price of Crude Oil (the country is highly dependent on imported Oil), the value of the US Dollar – most trade is conducted in USD – and the level of foreign investment, are all influential. Direct intervention by the Reserve Bank of India (RBI) in FX markets to keep the exchange rate stable, as well as the level of interest rates set by the RBI, are further major influencing factors on the Rupee.
The Reserve Bank of India (RBI) actively intervenes in forex markets to maintain a stable exchange rate, to help facilitate trade. In addition, the RBI tries to maintain the inflation rate at its 4% target by adjusting interest rates. Higher interest rates usually strengthen the Rupee. This is due to the role of the ‘carry trade’ in which investors borrow in countries with lower interest rates so as to place their money in countries’ offering relatively higher interest rates and profit from the difference.
Macroeconomic factors that influence the value of the Rupee include inflation, interest rates, the economic growth rate (GDP), the balance of trade, and inflows from foreign investment. A higher growth rate can lead to more overseas investment, pushing up demand for the Rupee. A less negative balance of trade will eventually lead to a stronger Rupee. Higher interest rates, especially real rates (interest rates less inflation) are also positive for the Rupee. A risk-on environment can lead to greater inflows of Foreign Direct and Indirect Investment (FDI and FII), which also benefit the Rupee.
Higher inflation, particularly, if it is comparatively higher than India’s peers, is generally negative for the currency as it reflects devaluation through oversupply. Inflation also increases the cost of exports, leading to more Rupees being sold to purchase foreign imports, which is Rupee-negative. At the same time, higher inflation usually leads to the Reserve Bank of India (RBI) raising interest rates and this can be positive for the Rupee, due to increased demand from international investors. The opposite effect is true of lower inflation.
Recommended Articles


