EUR/JPY Price Analysis: Extends its upside, the next hurdle is seen at 169.40

Source Fxstreet
  • EUR/JPY gains momentum near 169.20 in Friday’s early European session. 
  • The cross keeps the bullish vibe unchanged above the key EMA, with the RSI indicator standing above the 50-midline.
  • The first upside barrier is seen at 169.40; 167.80 acts as an initial support level. 

The EUR/JPY cross extends the rally around 169.20 during the early European trading hours on Friday. The Japanese Yen (JPY) has weakened as Japan's economy contracted more than expected in the first quarter (Q1) of 2024, challenging the Bank of Japan's (BoJ) push to get interest rates further away from near zero. On Friday, the BoJ left the amount of bonds it buys at regular operations unchanged, adding to a modest dip in the JPY after helping the currency earlier in the week with a surprise reduction in purchases, per Bloomberg. 

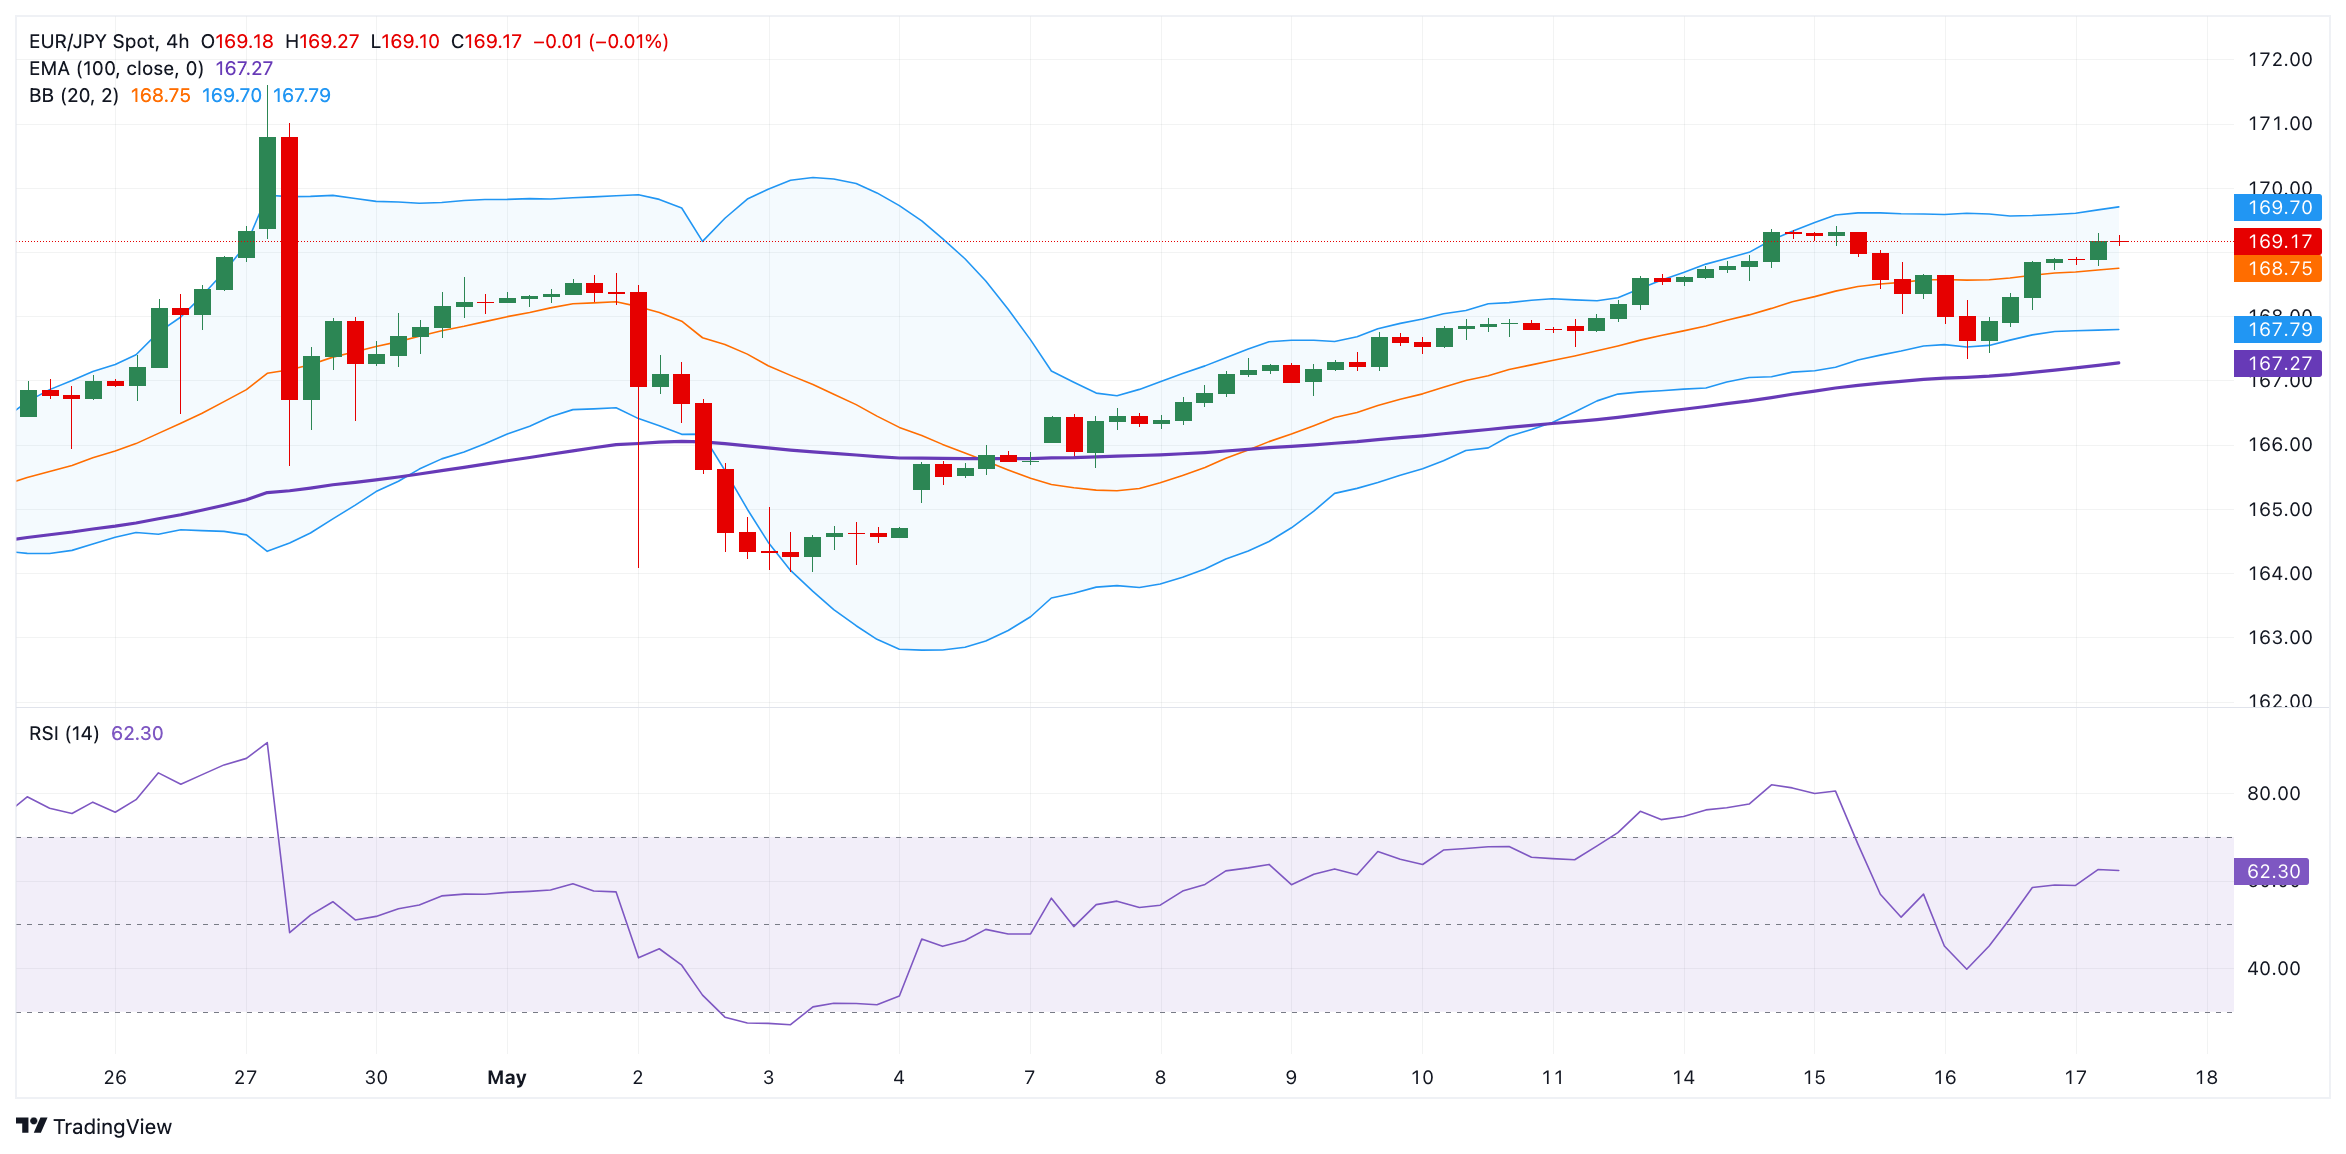
Technically, EUR/JPY maintains the bullish outlook unchanged as the cross holds above the 100-period Exponential Moving Averages (EMA) on the four-hour chart. The upward momentum is backed by the Relative Strength Index (RSI), which stands in bullish territory near 62.60, supporting the buyers for the time being.  

The immediate resistance level for the cross will emerge near a high of May 15 at 169.40. The additional upside filter to watch is the 170.00 psychological round figure. A decisive break above the latter will see a rally to the next barrier around a high of April 29 at 171.60. 

On the flip side, the first downside target is seen at the 100-period EMA at 167.80. Further south, the next contention level is located near a low of May 16 at 167.33, followed by a low of April 29 at 165.66. 

EUR/JPY four-hour chart

EUR/JPY

Overview
Today last price 169.27
Today Daily Change 0.41
Today Daily Change % 0.24
Today daily open 168.86
 
Trends
Daily SMA20 166.95
Daily SMA50 164.87
Daily SMA100 162.68
Daily SMA200 160.71
 
Levels
Previous Daily High 168.91
Previous Daily Low 167.33
Previous Weekly High 167.97
Previous Weekly Low 164.48
Previous Monthly High 171.6
Previous Monthly Low 162.28
Daily Fibonacci 38.2% 168.31
Daily Fibonacci 61.8% 167.93
Daily Pivot Point S1 167.82
Daily Pivot Point S2 166.79
Daily Pivot Point S3 166.24
Daily Pivot Point R1 169.4
Daily Pivot Point R2 169.95
Daily Pivot Point R3 170.98


Disclaimer: For information purposes only. Past performance is not indicative of future results.
placeholder
Nvidia Earnings Approach: Can It Drive a Nasdaq Rebound? What Should Investors Watch Most?On May 20, ET, NVIDIA ( NVDA )'s first-quarter fiscal 2026 earnings report, to be released after the market close, has become the market focus. The options market has already reacted; bas
Author  TradingKey
11 hours ago
On May 20, ET, NVIDIA ( NVDA )'s first-quarter fiscal 2026 earnings report, to be released after the market close, has become the market focus. The options market has already reacted; bas
placeholder
Gold Prices Fall Below Key $4,500 Mark, US Treasury Yields Rise for Seventh Day, Gold May Fall to $4,100On Tuesday (May 19), gold ( XAUUSD) closed at $4,481.89. The price confirmed a break below $4,500, further opening up the downside. On Wednesday, gold extended its downward trend from the
Author  TradingKey
18 hours ago
On Tuesday (May 19), gold ( XAUUSD) closed at $4,481.89. The price confirmed a break below $4,500, further opening up the downside. On Wednesday, gold extended its downward trend from the
placeholder
Gold falls below $4,500 on rising global rate hike bets Gold price (XAU/USD) faces some selling pressure near $4,480 during the early Asian session on Wednesday. The precious metal drops to its lowest since March 30 as persistent inflation fears keep interest rate hike expectations and Treasury yields high.
Author  FXStreet
20 hours ago
Gold price (XAU/USD) faces some selling pressure near $4,480 during the early Asian session on Wednesday. The precious metal drops to its lowest since March 30 as persistent inflation fears keep interest rate hike expectations and Treasury yields high.
placeholder
Bitcoin Price Forecast: BTC battles at key technical zone amid mixed flow signalsBitcoin (BTC) steadies around the key technical support on Tuesday after its recent correction. The Crypto King’s next directional move could hinge on this key technical zone.
Author  FXStreet
Yesterday 10: 07
Bitcoin (BTC) steadies around the key technical support on Tuesday after its recent correction. The Crypto King’s next directional move could hinge on this key technical zone.
placeholder
WTI declines below $102.00 after Trump says he called off Iran attacksWest Texas Intermediate (WTI), the US crude oil benchmark, is trading around $101.85 during the early Asian trading hours on Tuesday. The WTI price declines after US President Donald Trump said he was holding off a military attack on Iran planned for Tuesday at the request of Gulf states.
Author  FXStreet
Yesterday 01: 17
West Texas Intermediate (WTI), the US crude oil benchmark, is trading around $101.85 during the early Asian trading hours on Tuesday. The WTI price declines after US President Donald Trump said he was holding off a military attack on Iran planned for Tuesday at the request of Gulf states.
Related Instrument
goTop
quote