GBP/USD Price Analysis: Tumbles below crucial 1.2500 as bears move in

Source Fxstreet
May 2, 2024 14:57
  • GBP/USD drops 0.30%, US Dollar rises on positive US trade and labor data.
  • The GBP/USD struggles below 200-DMA at 1.2550, trending down.
  • RSI indicates bearish momentum; sellers control the market.
  • Recovery above 1.2500 could retest 200-DMA, with resistance at 1.2569 and 50-DMA at 1.2613.

The Pound Sterling tumbled in early trading during the North American session, dropping below the 1.2500 figure amid renewed US Dollar strength. Data from the United States showed that the Balance of Trade deficit tightened while the labor market remained tight, as revealed by the Initial Jobless Claims report. The GBP/USD trades at 1.2488, down 0.30%.

GBP/USD Price Analysis: Technical outlook

From a technical standpoint, the GBP/USD is showing a neutral to downward bias. This is a result of buyers failing to breach the significant resistance at the 200-day moving average (DMA) at 1.2550. This failure has further intensified the major’s drop below the 1.2500 figure, potentially paving the way for a test of the latest cycle low seen at 1.2299, the April 22 low.

Momentum points to a continuation of the downtrend, as the Relative Strength Index (RSI) turned bearish on April 30. As of writing, it aims downward, meaning sellers remain in charge.

On the other hand, if buyers reclaim 1.2500, they must reclaim the 200-DMA ahead of testing the April 29 high at 1.2569. Once cleared, the next stop would be the 1.2600 mark, followed by the 50-DMA at 1.2613. Further gains are seen above the 100-DMA at 1.2644.

GBP/USD Price Action – Daily Chart
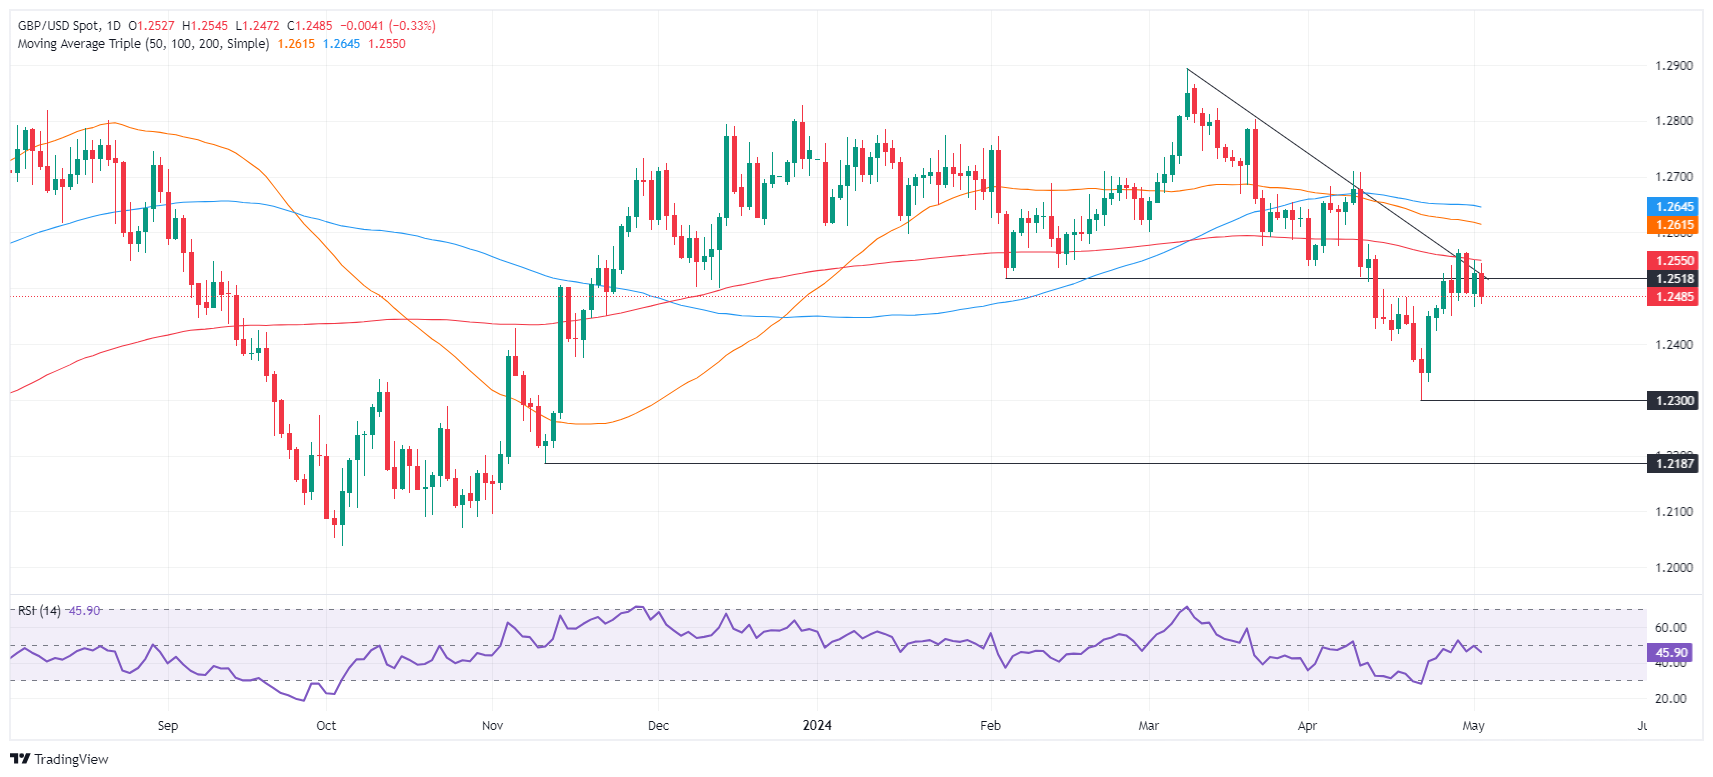
GBP/USD

Overview
Today last price 1.2481
Today Daily Change -0.0045
Today Daily Change % -0.36
Today daily open 1.2526
 
Trends
Daily SMA20 1.2507
Daily SMA50 1.2618
Daily SMA100 1.2648
Daily SMA200 1.2551
 
Levels
Previous Daily High 1.255
Previous Daily Low 1.2466
Previous Weekly High 1.2542
Previous Weekly Low 1.23
Previous Monthly High 1.2709
Previous Monthly Low 1.23
Daily Fibonacci 38.2% 1.2518
Daily Fibonacci 61.8% 1.2498
Daily Pivot Point S1 1.2479
Daily Pivot Point S2 1.2431
Daily Pivot Point S3 1.2395
Daily Pivot Point R1 1.2562
Daily Pivot Point R2 1.2598
Daily Pivot Point R3 1.2646


Disclaimer: For information purposes only. Past performance is not indicative of future results.
placeholder
GBP/JPY sticks close to 197.00 as Yen weakens furtherAfter recovering from a mid-week pullback, GBP/JPY scrambled back towards the 197.00 handle on Thursday.
Source  Fxstreet
After recovering from a mid-week pullback, GBP/JPY scrambled back towards the 197.00 handle on Thursday.
placeholder
Mexican Peso rallies as softer US inflation data weighs on US DollarThe Mexican Peso erased two days of losses and rallies against the US Dollar on Wednesday after the latter continued to weaken due to a softer-than-expected US inflation report.
Source  Fxstreet
The Mexican Peso erased two days of losses and rallies against the US Dollar on Wednesday after the latter continued to weaken due to a softer-than-expected US inflation report.
placeholder
Canadian Dollar treads water on tepid MondayThe Canadian Dollar (CAD) churned within familiar levels on Monday as a data-light economic calendar kicks off the new trading week.
Source  Fxstreet
The Canadian Dollar (CAD) churned within familiar levels on Monday as a data-light economic calendar kicks off the new trading week.
goTop
quote