

GBP/JPY sticks close to 197.00 as Yen weakens further
- GBP/JPY recovers to familiar highs as JPY recedes.
- Japanese GDP growth contracted faster than expected.
- Sterling traders looking ahead to next week’s UK CPI inflation.
After recovering from a mid-week pullback, GBP/JPY scrambled back towards the 197.00 handle on Thursday. The pair regained ground after Japan’s Gross Domestic Product (GDP) for the first quarter contracted faster than investors expected, further weakening the Japanese Yen (JPY).
Japan reported a -0.5% contraction in Q1 GDP, a deeper growth pullback than median market forecasts of -0.4%. The previous quarter also saw a small downside revision, to 0.0% from the initial print of 0.1%.
Little else of note remains on the economic calendar this week for the Guppy, leaving Sterling traders to focus on next week’s upcoming UK Consumer Price Index (CPI) inflation update. Bank of England (BoE) Governor Andrew Bailey will also be making an appearance, and traders are expected to look for clues about the BoE’s possible path toward rate cuts. BoE Governor Bailey will be speaking at the London School of Economics next Tuesday.
GBP/JPY technical outlook
The Guppy is back into chart paper near the 197.00 handle on Thursday after catching a technical bounce from the 200-hour Exponential Moving Average (EMA) near 195.50. The pair fell in a near-term pullback after intense buying dragged the pair 3% higher from the last swing low into 191.50, but bulls are stepping back in to force the Yen lower against the GBP.
GBP/JPY hourly chart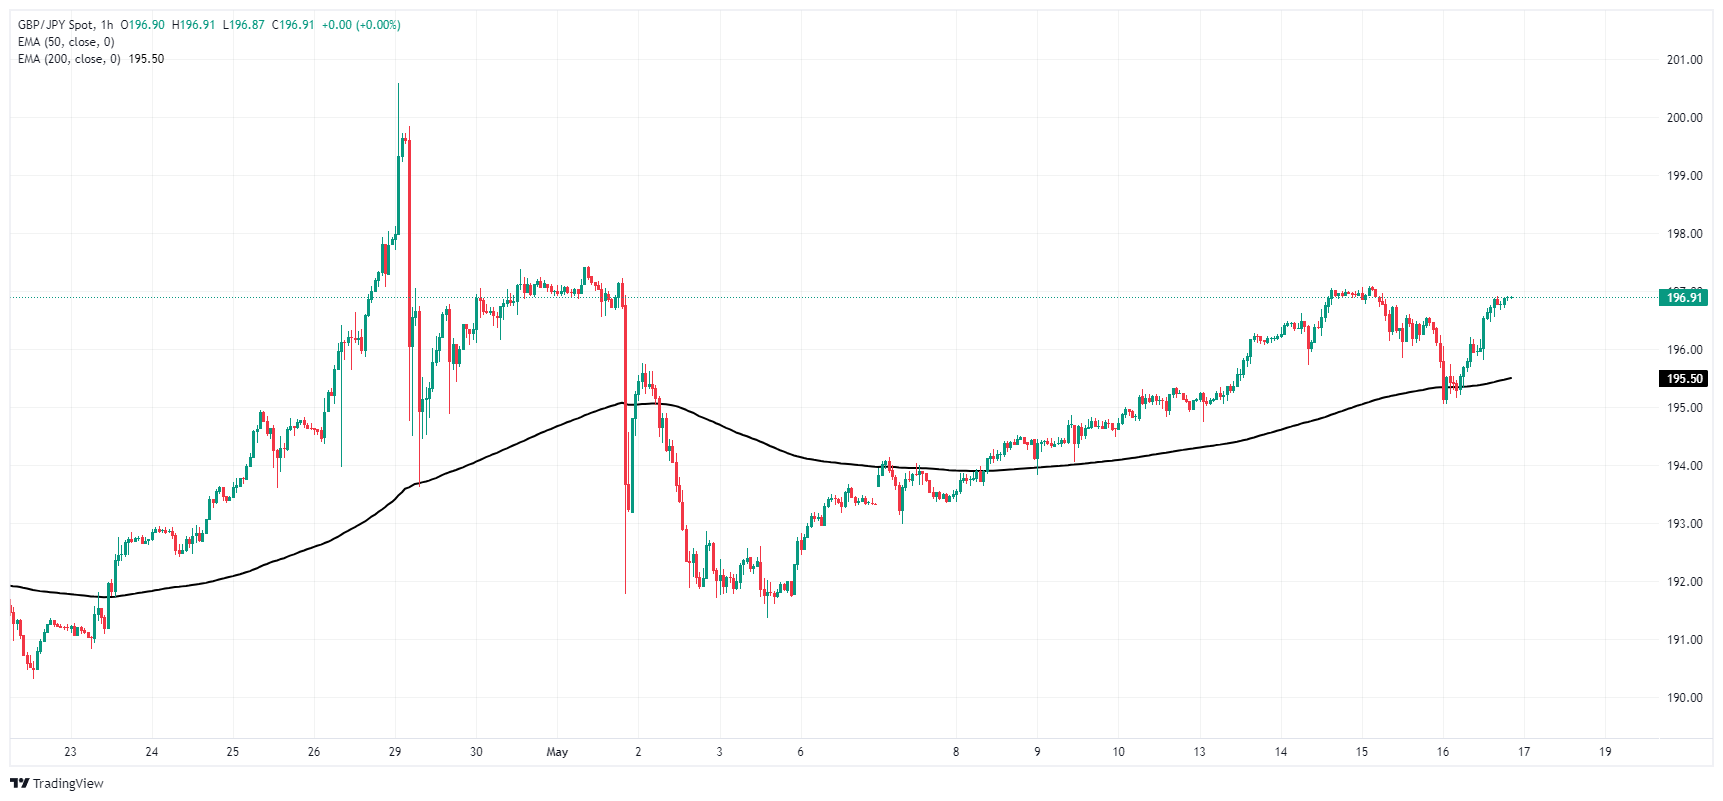
GBP/JPY daily chart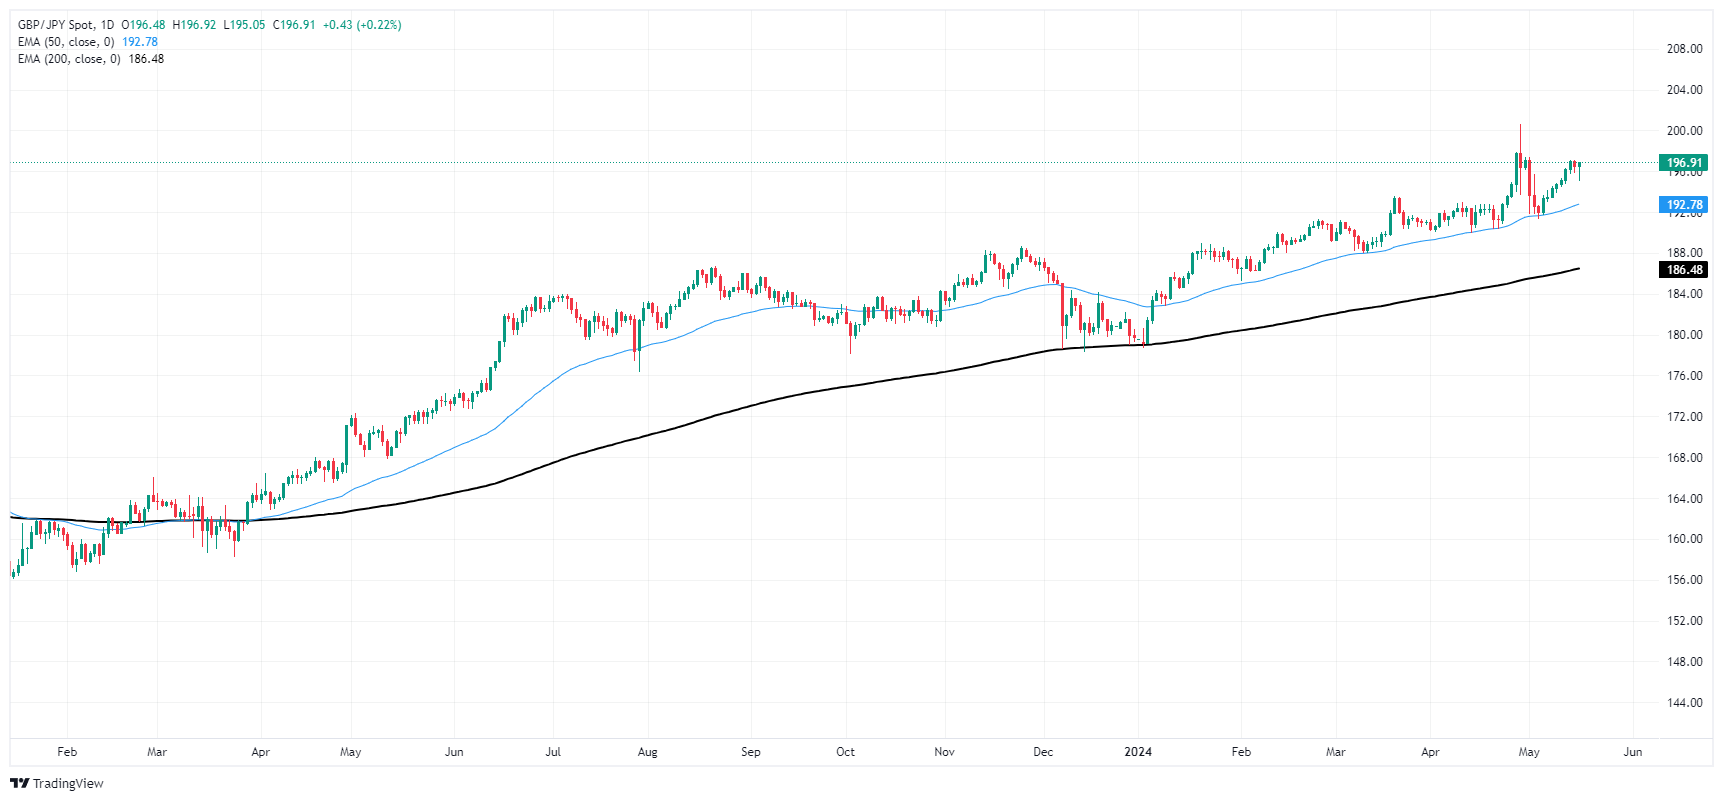
Recommended Articles


