

EUR/USD continues slogging higher prior to March US core PCE
- EUR/USD steadily climbs back above 1.0700 again despite weakness following inflationary US GDP data.
- Further volatility is possible once the core Personal Expenditures Price Index for March is released on Friday.
- The report could further tone the outlook for US interest rates, impacting the value of USD.
EUR/USD trades in the 1.0740s on Friday, ahead of key data out of the US in the form of the March core Personal Consumption Expenditures Price Index (PCE), the US Federal Reserve’s (Fed) preferred gauge of inflation.
The pair lost ground on Thursday after the release of the Q1 US GDP report but has since recovered and resumed its short-term uptrend.
The core PCE data, which is released by the US Bureau of Economic Analysis (BEA) at 12:30 GMT, could alter market perceptions about the timing of Fed interest-rate cuts with implications for EUR/USD.
EUR/USD recovers from post-GDP data decline
EUR/USD has recovered back up to the 1.0730s after declining sharply to a low of 1.0678 on Thursday following the release of US first-quarter GDP data. Although annualized GDP growth missed consensus expectations and fell below the previous quarter’s growth rate, the Personal Consumption Expenditures Prices component, which measures the change in prices of goods, came in way higher compared with previous quarter and supported the US Dollar (USD).
The inflationary data meant that markets dialed back their expectation of when the Federal Reserve (Fed) will start cutting interest rates, with the chance of a rate cut by the July meeting falling from 50% on the previous day to 34% afterwards, according to analysts at Deutsche Bank.
The expectation of interest rates staying higher for longer temporarily strengthened the Greenback – but weighed on EUR/USD – because higher interest rates attract more foreign capital inflows.
EUR/USD at risk of more volatility
EUR/USD may now be vulnerable to more volatility when the monthly core PCE is released at 12:30 GMT. Although the market has already been alerted to a likely upside surprise by the data in the GDP report for the quarter, the core PCE for March out on Friday will provide more detail.
EUR/USD is likely to decline if core PCE shows a reading that is higher than the 2.6% expected by economists (0.3% MoM), particularly if it is above the 2.8% reading from the previous month. A higher-than-forecast reading would indicate persistent price pressures and encourage the Fed to maintain interest rates at their current level for longer.
A lower-than-forecast reading would bring forward the time the Fed is expected to make its first interest-rate cut, weakening USD and lifting the EUR/USD exchange rate.
The CME FedWatch Tool, a market-based gauge of when the Fed is likely to alter interest rates, places the first rate cut as happening in September, with a 59% probability.
Beyond the US PCE data, the calendar shows little in the way of hard data that is likely to impact the Euro (EUR) side of the pair, although commentary from European Central Bank (ECB) officials could still cause some turbulence.
Technical Analysis: EUR/USD continues slowly correcting higher
EUR/USD continues correcting higher despite experiencing a pullback down below the 1.0700 level after the release of US GDP data on Thursday.
It has broken out of the rectangular range it was trading in on the 4-hour chart after piercing above the rectangle’s ceiling at 1.0700.
The Bear Flag price pattern which was unfolding between April 16-22 looks deformed by the persistent price action above 1.0700 and is less credible.
EUR/USD 4-hour Chart
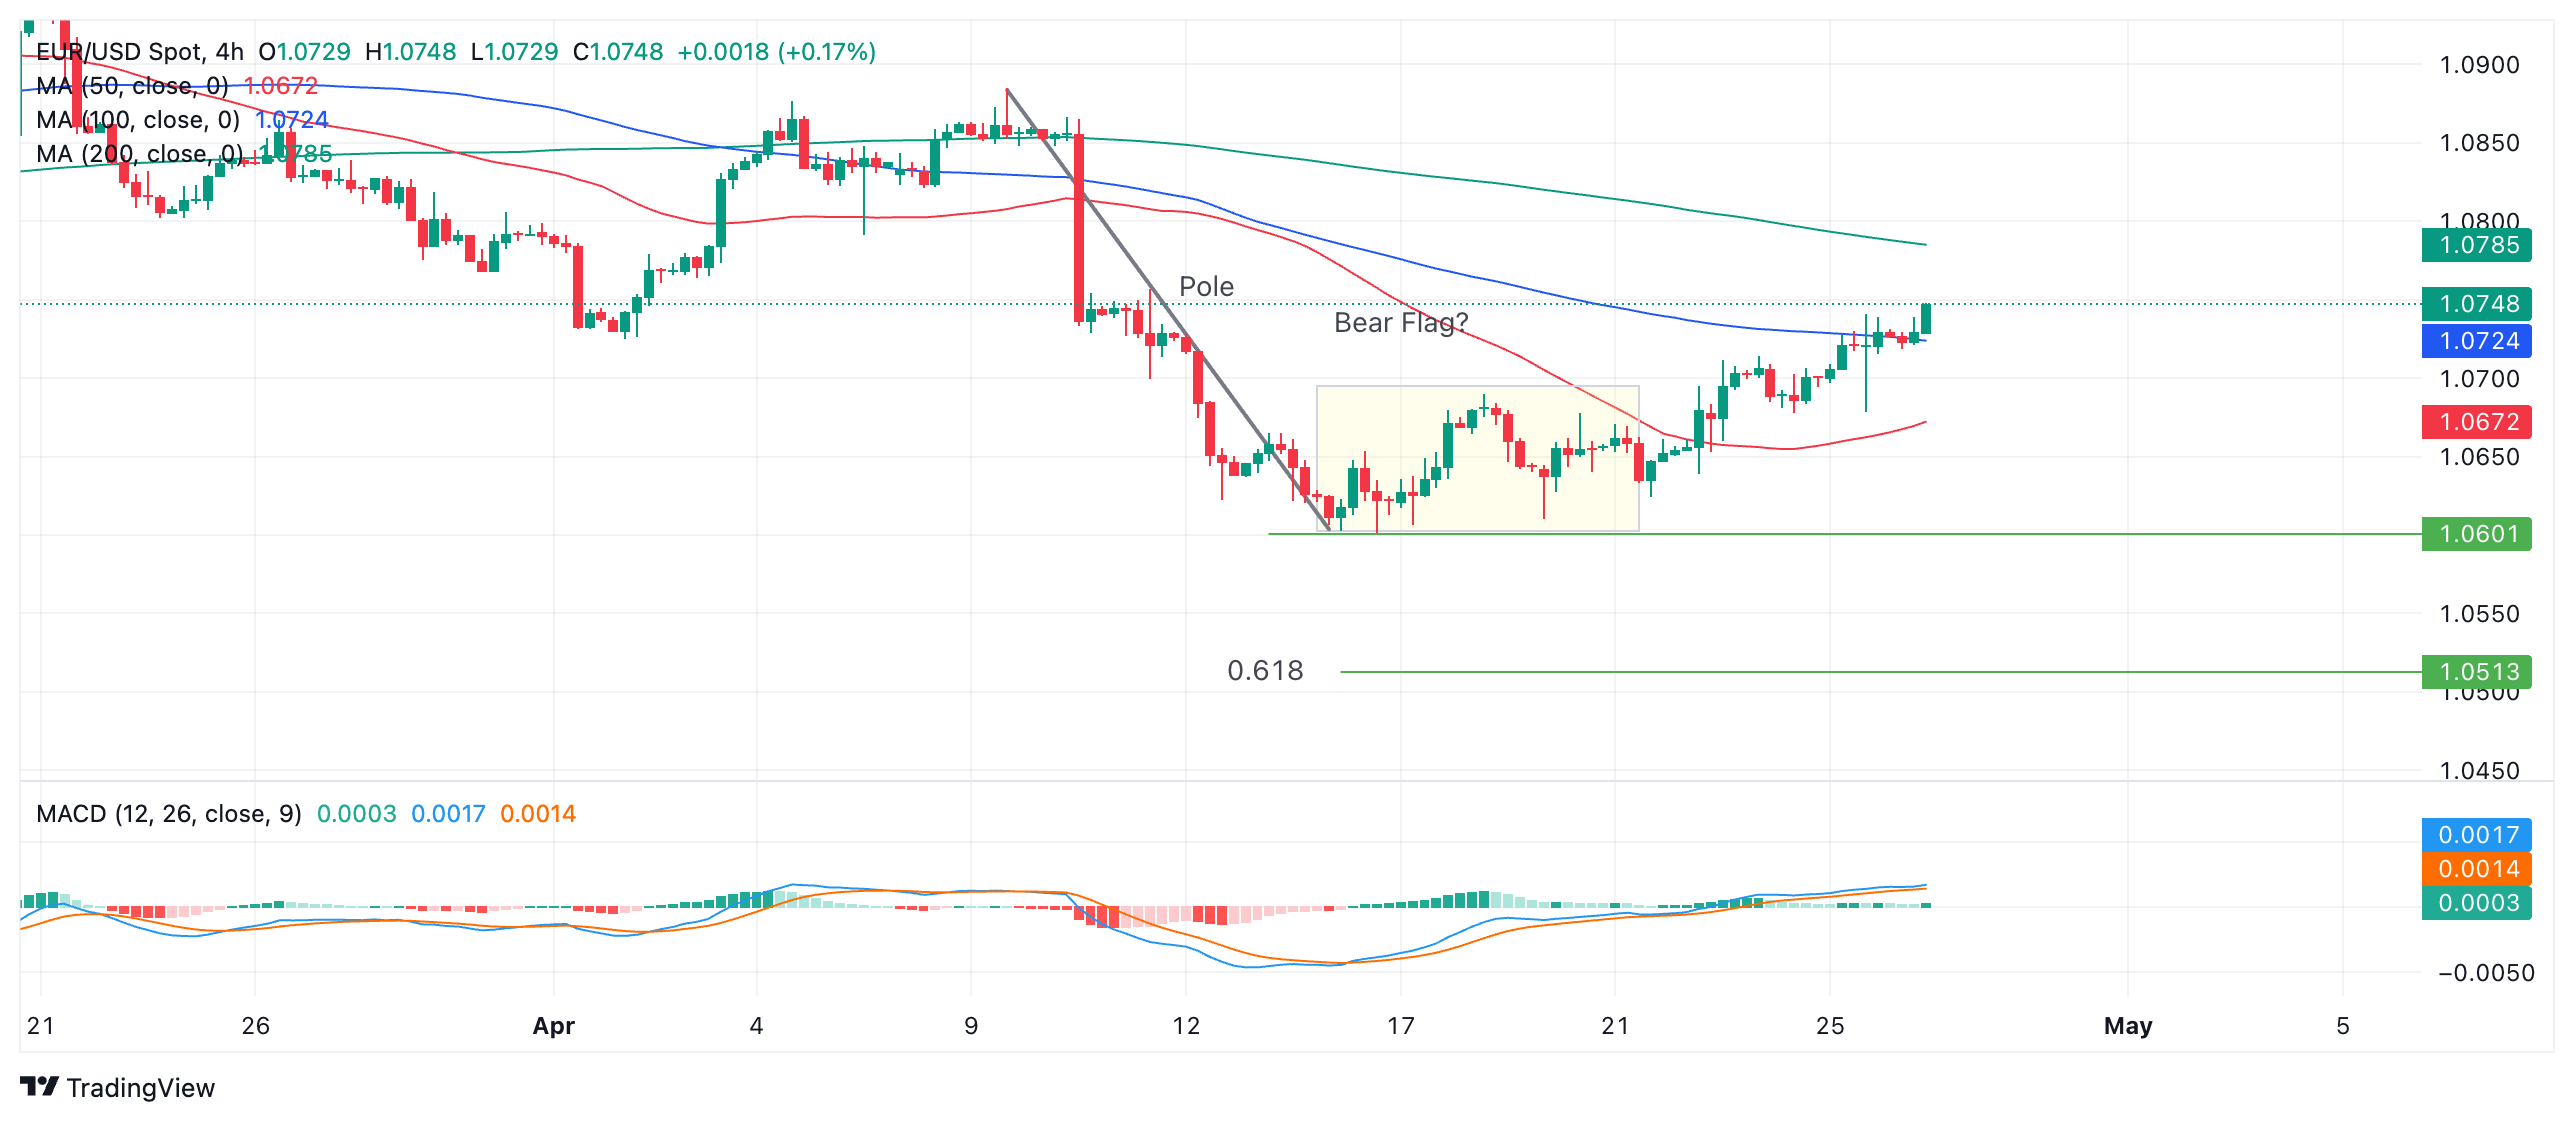
The establishment of a rising sequence of peaks and troughs on the 4-hour chart strengthens the argument that the short-term trend has turned bullish and therefore suggestive of more gains.
If it continues marching higher, resistance from a previous lower high on April 11 gives an initial target at 1.0757. Then the 50-day and 200-day Simple Moving Averages (SMA) on the daily chart (not shown) are likely to resist at 1.0807.
On the other hand, a break below the 1.0601 April 16 low would revive the Bear Flag hypothesis.
According to technical lore, the expected move down from a Bear Flag equals the length of the preceding “pole” or a Fibonacci ratio of the pole.
The Fibonacci 0.618 ratio of the pole extrapolated lower gives a conservative target at 1.0503. The next concrete target is at 1.0448 – the October 2023 low. A fall of equal length to the pole would take EUR/USD to 1.0403.
Economic Indicator
Core Personal Consumption Expenditures - Price Index (YoY)
The Core Personal Consumption Expenditures (PCE), released by the US Bureau of Economic Analysis on a monthly basis, measures the changes in the prices of goods and services purchased by consumers in the United States (US). The PCE Price Index is also the Federal Reserve’s (Fed) preferred gauge of inflation. The YoY reading compares the prices of goods in the reference month to the same month a year earlier. The core reading excludes the so-called more volatile food and energy components to give a more accurate measurement of price pressures." Generally, a high reading is bullish for the US Dollar (USD), while a low reading is bearish.
Read more.Next release: Fri Apr 26, 2024 12:30
Frequency: Monthly
Consensus: 2.6%
Previous: 2.8%
Source: US Bureau of Economic Analysis
After publishing the GDP report, the US Bureau of Economic Analysis releases the Personal Consumption Expenditures (PCE) Price Index data alongside the monthly changes in Personal Spending and Personal Income. FOMC policymakers use the annual Core PCE Price Index, which excludes volatile food and energy prices, as their primary gauge of inflation. A stronger-than-expected reading could help the USD outperform its rivals as it would hint at a possible hawkish shift in the Fed’s forward guidance and vice versa.
Recommended Articles


