Canadian Dollar recovery stalls on strong US data, hawkish Fedspeak

Source Fxstreet
  • Upbeat US data and hawkish comments by Fed’s Williams throw a spanner on Canadian Dollar’s recovery
  • US Initial Jobless Claims and housing data endorse belief in strong labor market, hot inflationary trends. 
  • USD/CAD pullback is losing steam right above 1.3730 support area.

The Canadian Dollar (CAD) is trading higher for the second consecutive session on Thursday, yet with weaker bullish momentum. Strong US macroeconomic data and hawkish comments from New York Federal Reserve (Fed) President John Williams have provided some support to the USD.

US Initial Jobless Claims remained steady at relatively low levels last week. At the same time, the Philadelphia Fed Manufacturing Survey posted its best reading in a year, adding to the evidence of the strong US economic momentum.

Furthermore, US Existing Home Sales declined in March although their median price jumped 4.8% over the last twelve months, suggesting an inflationary contribution to the Consumer Price Index (CPI). In this context, Fed’s Williams has reiterated the idea that there is no urgency to rate cuts, putting the brakes on Canadian Dollar’s appreciation.

Daily digest market movers: USD/CAD finds support on back of strong US data

Canadian Dollar remains positive on Thursday despite USD trimming some losses. .
 

US Weekly Jobless Claims remain steady at 212K in the week of April 12, against expectations of an increase to 215K.
 

Philadelphia Fed Manufacturing Survey has increased to a 15.5 reading in April from 3.2 in March. The market had anticipated a decline to 1.5.
 

Existing Home Sales declined 4.3% in March after a 9.5% increase in February, although these data have been offset by the 4.8% yearly increment of the median sales price.
 

Fed’s Williams has stuck to the line that Fed decisions will be data-driven, reiterating that there is no rush to cut interest rates.
 

On Wednesday, US Beige Book reflected steady economic growth combined with sticky inflation expectations, a combination that has prompted investors to dial down Fed easing bets.
 

Bets for a Fed rate cut in July have dropped to 37% from 50% at the beginning of the week. Investors are now pricing in 40 bps of cuts in 2024, down from 150 bps in January.

Canadian Dollar price this week

The table below shows the percentage change of Canadian Dollar (CAD) against listed major currencies this week. Canadian Dollar was the strongest against the Japanese Yen.

  USD EUR GBP CAD AUD JPY NZD CHF
USD   -0.07% 0.03% 0.00% 0.66% 0.87% 0.52% -0.25%
EUR 0.07%   0.09% 0.08% 0.74% 0.93% 0.60% -0.18%
GBP -0.03% -0.10%   -0.01% 0.64% 0.84% 0.50% -0.29%
CAD -0.01% -0.09% 0.01%   0.65% 0.86% 0.51% -0.30%
AUD -0.67% -0.74% -0.65% -0.66%   0.21% -0.14% -0.93%
JPY -0.86% -0.94% -0.83% -0.87% -0.21%   -0.33% -1.14%
NZD -0.54% -0.60% -0.52% -0.51% 0.14% 0.35%   -0.79%
CHF 0.26% 0.18% 0.29% 0.27% 0.92% 1.12% 0.78%  

The heat map shows percentage changes of major currencies against each other. The base currency is picked from the left column, while the quote currency is picked from the top row. For example, if you pick the Euro from the left column and move along the horizontal line to the Japanese Yen, the percentage change displayed in the box will represent EUR (base)/JPY (quote).

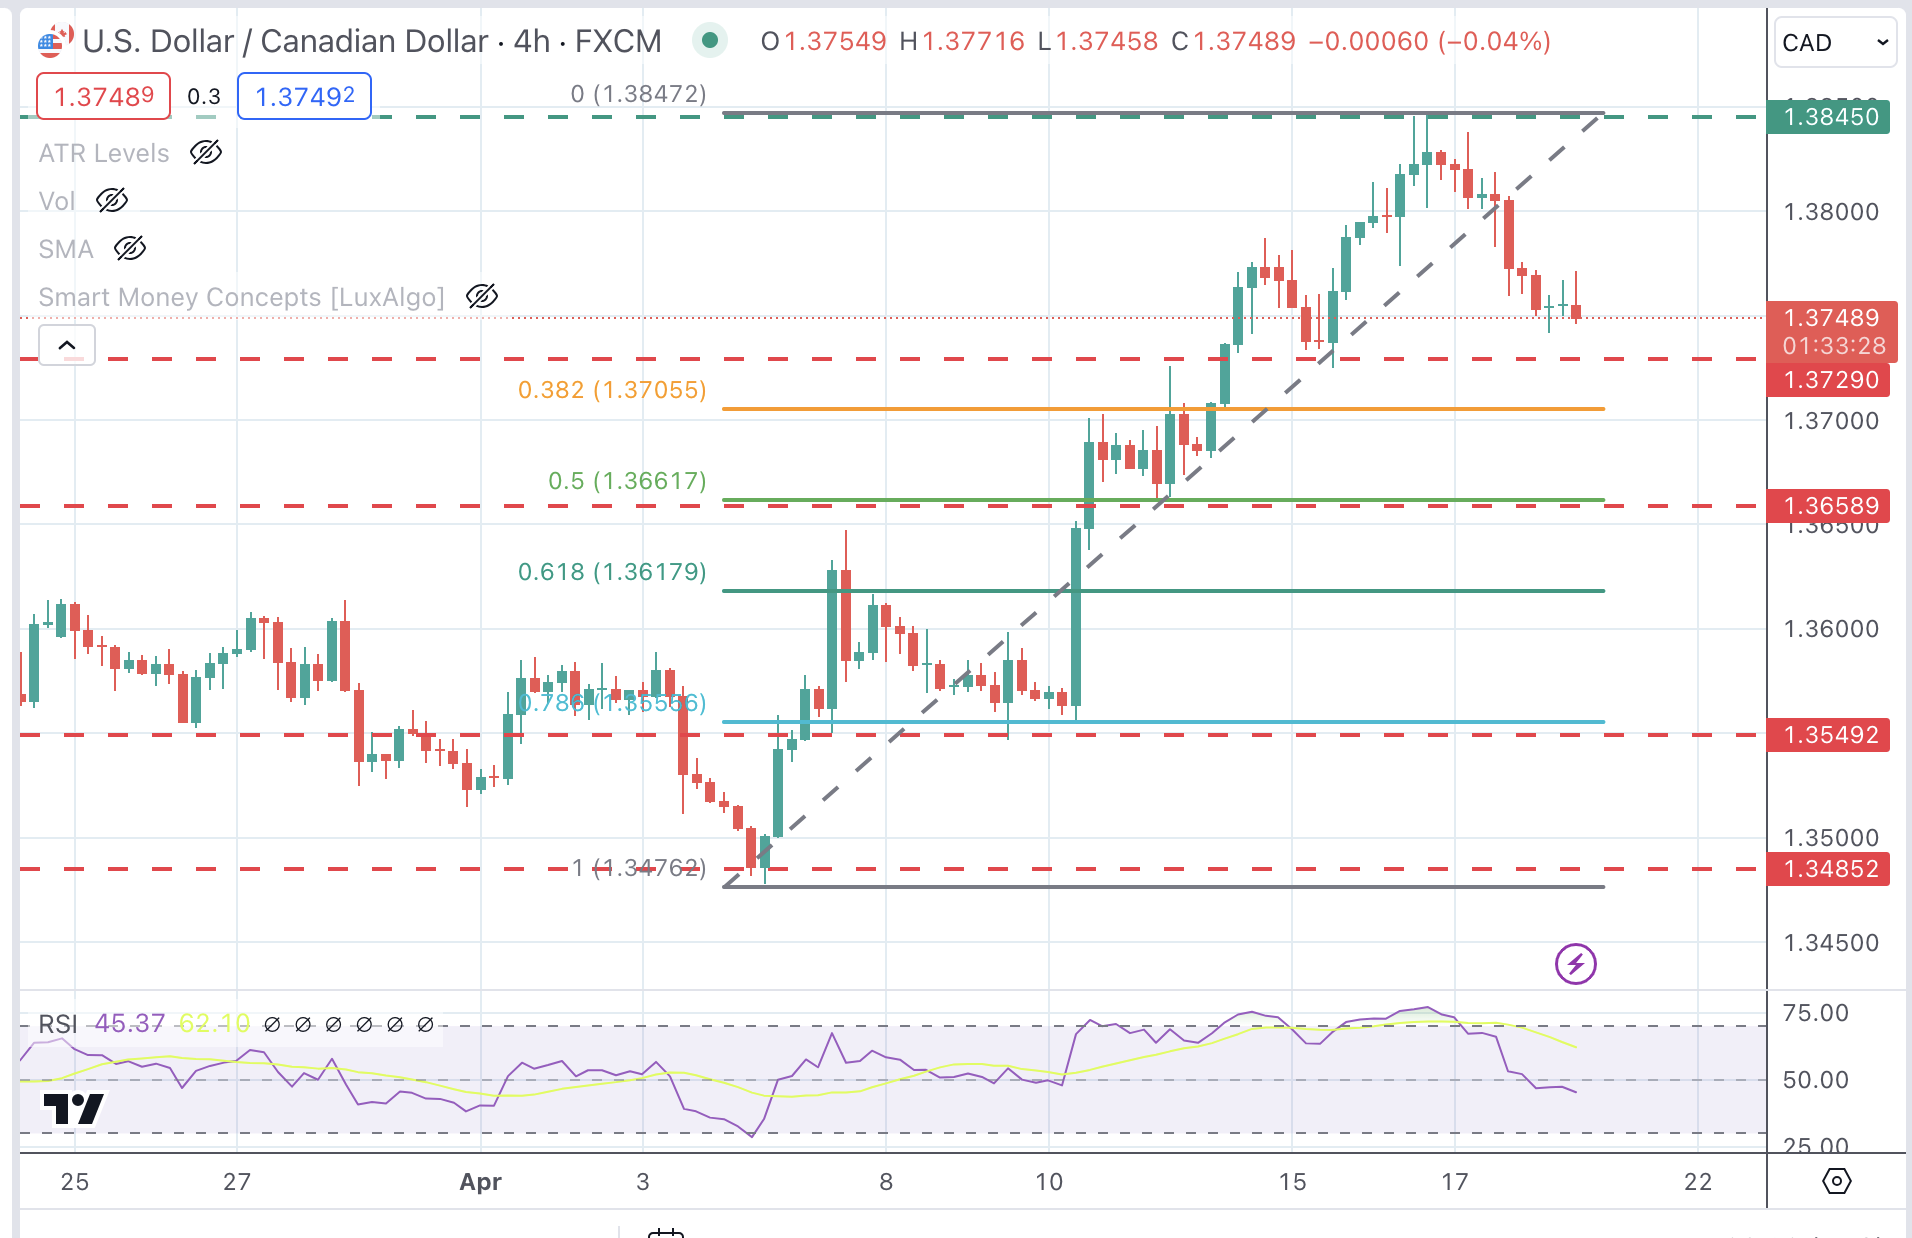
Technical analysis: USD/CAD in corrective pullback with bears looking at 1.3730 support area

The broader US Dollar trend remains positive, although the pair is going through a corrective pullback from overbought levels. Technical indicators are showing a moderate bearish momentum although the pair has stalled right above the 1.3730 support area,  following a five-day rally.

A deeper reversal below the mentioned 1.3730 level might find support at the 38.2% Fibonacci retracement level of April’s rally at 1.3705 and at  1.3660. On the upside, the immediate resistance is at 1.3845. Resistances are at 1.3784 and 1.3845.

USD/CAD 4-hour Chart

Canadian Dollar FAQs

The key factors driving the Canadian Dollar (CAD) are the level of interest rates set by the Bank of Canada (BoC), the price of Oil, Canada’s largest export, the health of its economy, inflation and the Trade Balance, which is the difference between the value of Canada’s exports versus its imports. Other factors include market sentiment – whether investors are taking on more risky assets (risk-on) or seeking safe-havens (risk-off) – with risk-on being CAD-positive. As its largest trading partner, the health of the US economy is also a key factor influencing the Canadian Dollar.

The Bank of Canada (BoC) has a significant influence on the Canadian Dollar by setting the level of interest rates that banks can lend to one another. This influences the level of interest rates for everyone. The main goal of the BoC is to maintain inflation at 1-3% by adjusting interest rates up or down. Relatively higher interest rates tend to be positive for the CAD. The Bank of Canada can also use quantitative easing and tightening to influence credit conditions, with the former CAD-negative and the latter CAD-positive.

The price of Oil is a key factor impacting the value of the Canadian Dollar. Petroleum is Canada’s biggest export, so Oil price tends to have an immediate impact on the CAD value. Generally, if Oil price rises CAD also goes up, as aggregate demand for the currency increases. The opposite is the case if the price of Oil falls. Higher Oil prices also tend to result in a greater likelihood of a positive Trade Balance, which is also supportive of the CAD.

While inflation had always traditionally been thought of as a negative factor for a currency since it lowers the value of money, the opposite has actually been the case in modern times with the relaxation of cross-border capital controls. Higher inflation tends to lead central banks to put up interest rates which attracts more capital inflows from global investors seeking a lucrative place to keep their money. This increases demand for the local currency, which in Canada’s case is the Canadian Dollar.

Macroeconomic data releases gauge the health of the economy and can have an impact on the Canadian Dollar. Indicators such as GDP, Manufacturing and Services PMIs, employment, and consumer sentiment surveys can all influence the direction of the CAD. A strong economy is good for the Canadian Dollar. Not only does it attract more foreign investment but it may encourage the Bank of Canada to put up interest rates, leading to a stronger currency. If economic data is weak, however, the CAD is likely to fall.


Disclaimer: For information purposes only. Past performance is not indicative of future results.
placeholder
Gold Price Forecast: XAU/USD drifts higher above $4,200 as Fed delivers expected cutGold price (XAU/USD) gains momentum to around $4,235 during the early Asian session on Thursday. The precious metal extends its upside after the US Federal Reserve (Fed) delivered an expected third consecutive interest rate cut and maintained its outlook for just one cut in 2026.
Author  FXStreet
Dec 11, Thu
Gold price (XAU/USD) gains momentum to around $4,235 during the early Asian session on Thursday. The precious metal extends its upside after the US Federal Reserve (Fed) delivered an expected third consecutive interest rate cut and maintained its outlook for just one cut in 2026.
placeholder
Ethereum Price Slips Lower — $3,000 Looms as the Key BattlegroundEthereum is attempting to recover from a $3,026 low but remains below $3,200 and the 100-hour SMA, with a bearish trend line near $3,175 capping rebounds as bulls need a clean break above $3,200 to target $3,250–$3,400, while a drop below $3,050 risks a retest of $3,000 and $2,940.
Author  Mitrade
Dec 15, Mon
Ethereum is attempting to recover from a $3,026 low but remains below $3,200 and the 100-hour SMA, with a bearish trend line near $3,175 capping rebounds as bulls need a clean break above $3,200 to target $3,250–$3,400, while a drop below $3,050 risks a retest of $3,000 and $2,940.
placeholder
Bitcoin Slides 5% as Sellers Lean In — Can BTC Reclaim $88,000?Bitcoin has dropped back below $88,000 after rolling over from $90,500, with price still trading under the 100-hour Simple Moving Average. The sell-off found a floor at $85,151, and BTC is now consolidating near that base, but rebounds are facing pressure from a bearish trend line around $89,000. Bulls need to retake $88,000–$89,000 to ease downside risk; failure to do so keeps $85,500–$85,000 and then $83,500 in play, with $80,000 as the deeper “line in the sand.” Bitcoin (BTC) is back in damage-control mode after a sharp pullback wiped out recent gains. The price failed to reclaim the $90,000–$90,500 band, rolled over, and slid through $88,500 before briefly dipping under $87,000. Buyers did show up around $85,000, but the rebound so far looks more like stabilization than a clear trend reversal. Bitcoin dips hard, finds a bid near $85,000(h3) BTC’s latest move lower began when it couldn’t build follow-through above $90,000 and $90,500. Once that upside stalled, sellers took control and pushed price down through $88,500. The slide accelerated enough to spike below $87,000, but the market didn’t free-fall. Bulls defended the $85,000 zone, printing a low at $85,151. Since then, Bitcoin has been consolidating below the 23.6% Fibonacci retracement of the drop from the $93,560 swing high to the $85,151 low — a clue that the bounce is still shallow and that sellers haven’t fully backed off yet. Structurally, BTC is still on the back foot: It’s trading below $88,000, and It remains below the 100-hour Simple Moving Average, keeping short-term trend pressure pointed downward. Resistance is layered, and $89,000 is the problem area(h3) If bulls try to turn this into a recovery, they’ll have to climb through multiple ceilings in quick succession. First, BTC faces resistance around $87,150, followed by a more meaningful barrier near $87,500. From there, the market’s attention snaps back to $88,000 — the level BTC just lost and now needs to reclaim. A close back above $88,000 would improve the tone, but it doesn’t solve the bigger issue: there’s a bearish trend line on the hourly BTC/USD chart (Kraken feed) with resistance near $89,000, which also lines up with the next technical hurdle. If BTC can push through $89,000 and hold, the rebound could extend toward $90,000, with follow-through targets at $91,000 and $91,500. But until price clears that $88,000–$89,000 zone, rallies are at risk of being sold rather than chased. If BTC fails to reclaim resistance, the downside path is clear(h3) The near-term bear case is simple: if Bitcoin can’t climb back above the $87,000 area and keep traction, sellers may attempt another leg lower. Support levels line up like this: Immediate support: $85,500 First major support: $85,000 Next support: $83,500 Then $82,500 in the near term Below that, the major “don’t break this” level is still $80,000. If BTC slips under $80,000, the risk of acceleration to the downside increases significantly — not because it’s magic, but because it’s the kind of psychological and structural level that tends to trigger forced de-risking. Indicators: momentum still leans bearish(h3) The intraday indicators aren’t offering much comfort yet: Hourly MACD is losing pace in the bearish zone. Hourly RSI remains below 50, suggesting sellers still have the upper hand on short timeframes. So while the $85,000 defense held for now, the market hasn’t flipped bullish — it’s just stopped bleeding.
Author  Mitrade
Dec 16, Tue
Bitcoin has dropped back below $88,000 after rolling over from $90,500, with price still trading under the 100-hour Simple Moving Average. The sell-off found a floor at $85,151, and BTC is now consolidating near that base, but rebounds are facing pressure from a bearish trend line around $89,000. Bulls need to retake $88,000–$89,000 to ease downside risk; failure to do so keeps $85,500–$85,000 and then $83,500 in play, with $80,000 as the deeper “line in the sand.” Bitcoin (BTC) is back in damage-control mode after a sharp pullback wiped out recent gains. The price failed to reclaim the $90,000–$90,500 band, rolled over, and slid through $88,500 before briefly dipping under $87,000. Buyers did show up around $85,000, but the rebound so far looks more like stabilization than a clear trend reversal. Bitcoin dips hard, finds a bid near $85,000(h3) BTC’s latest move lower began when it couldn’t build follow-through above $90,000 and $90,500. Once that upside stalled, sellers took control and pushed price down through $88,500. The slide accelerated enough to spike below $87,000, but the market didn’t free-fall. Bulls defended the $85,000 zone, printing a low at $85,151. Since then, Bitcoin has been consolidating below the 23.6% Fibonacci retracement of the drop from the $93,560 swing high to the $85,151 low — a clue that the bounce is still shallow and that sellers haven’t fully backed off yet. Structurally, BTC is still on the back foot: It’s trading below $88,000, and It remains below the 100-hour Simple Moving Average, keeping short-term trend pressure pointed downward. Resistance is layered, and $89,000 is the problem area(h3) If bulls try to turn this into a recovery, they’ll have to climb through multiple ceilings in quick succession. First, BTC faces resistance around $87,150, followed by a more meaningful barrier near $87,500. From there, the market’s attention snaps back to $88,000 — the level BTC just lost and now needs to reclaim. A close back above $88,000 would improve the tone, but it doesn’t solve the bigger issue: there’s a bearish trend line on the hourly BTC/USD chart (Kraken feed) with resistance near $89,000, which also lines up with the next technical hurdle. If BTC can push through $89,000 and hold, the rebound could extend toward $90,000, with follow-through targets at $91,000 and $91,500. But until price clears that $88,000–$89,000 zone, rallies are at risk of being sold rather than chased. If BTC fails to reclaim resistance, the downside path is clear(h3) The near-term bear case is simple: if Bitcoin can’t climb back above the $87,000 area and keep traction, sellers may attempt another leg lower. Support levels line up like this: Immediate support: $85,500 First major support: $85,000 Next support: $83,500 Then $82,500 in the near term Below that, the major “don’t break this” level is still $80,000. If BTC slips under $80,000, the risk of acceleration to the downside increases significantly — not because it’s magic, but because it’s the kind of psychological and structural level that tends to trigger forced de-risking. Indicators: momentum still leans bearish(h3) The intraday indicators aren’t offering much comfort yet: Hourly MACD is losing pace in the bearish zone. Hourly RSI remains below 50, suggesting sellers still have the upper hand on short timeframes. So while the $85,000 defense held for now, the market hasn’t flipped bullish — it’s just stopped bleeding.
placeholder
December Santa Claus Rally: New highs in sight for US and European stocks?Historical data show a rising trend of US and European stocks in December. If the momentum is strong, fund managers may rush in with a buying frenzy.
Author  Mitrade
Yesterday 02: 50
Historical data show a rising trend of US and European stocks in December. If the momentum is strong, fund managers may rush in with a buying frenzy.
placeholder
XRP’s Price Action Flashes a Warning Even as ETF Flows Stay PositiveXRP’s structure remains weak despite 18 straight positive closes in spot XRP ETFs, with analysts warning that $1.98 and other nearby resistance zones could cap rebounds unless the YO region is reclaimed, while deeper downside scenarios keep $1.53 on watch as a potential (not guaranteed) accumulation area.
Author  Mitrade
23 hours ago
XRP’s structure remains weak despite 18 straight positive closes in spot XRP ETFs, with analysts warning that $1.98 and other nearby resistance zones could cap rebounds unless the YO region is reclaimed, while deeper downside scenarios keep $1.53 on watch as a potential (not guaranteed) accumulation area.
goTop
quote