

NZD/USD Price Forecasts: Building up momentum above 0.5700
- The New Zealand Dollar extends gains against the USD and hits three-week highs above 0.5700.
- RBNZ-Fed monetary policy divergence is weighing on the US Dollar.
- Technically, the NZD/USD is under growing bullish pressure after breaking the negative structure.
The New Zealand Dollar is coming under growing bullish pressure against the US Dollar, after breaking above the 0.5680 resistance area. A somewhat firmer US Dollar is capping bulls on Thursday, but the Fed-RBNZ monetary policy divergence is likely to keep downside attempts limited.
The RBNZ cut its OCR rate by 25 basis points to a three-year low of 2.25%, as widely expected on Wednesday, but signalled the end of the easing cycle, as New Zealand’s economy starts to show signs of recovery.
The Fed, on the contrary, is expected to cut rates by 25 basis points in December, and rumours about the nomination of White House National Economic Council Director Kevin Hassett as the next Fed chair feed hopes of further rate cuts in 2026.
Technical Analysis: NZD/USD has broken the immediate bearish structure
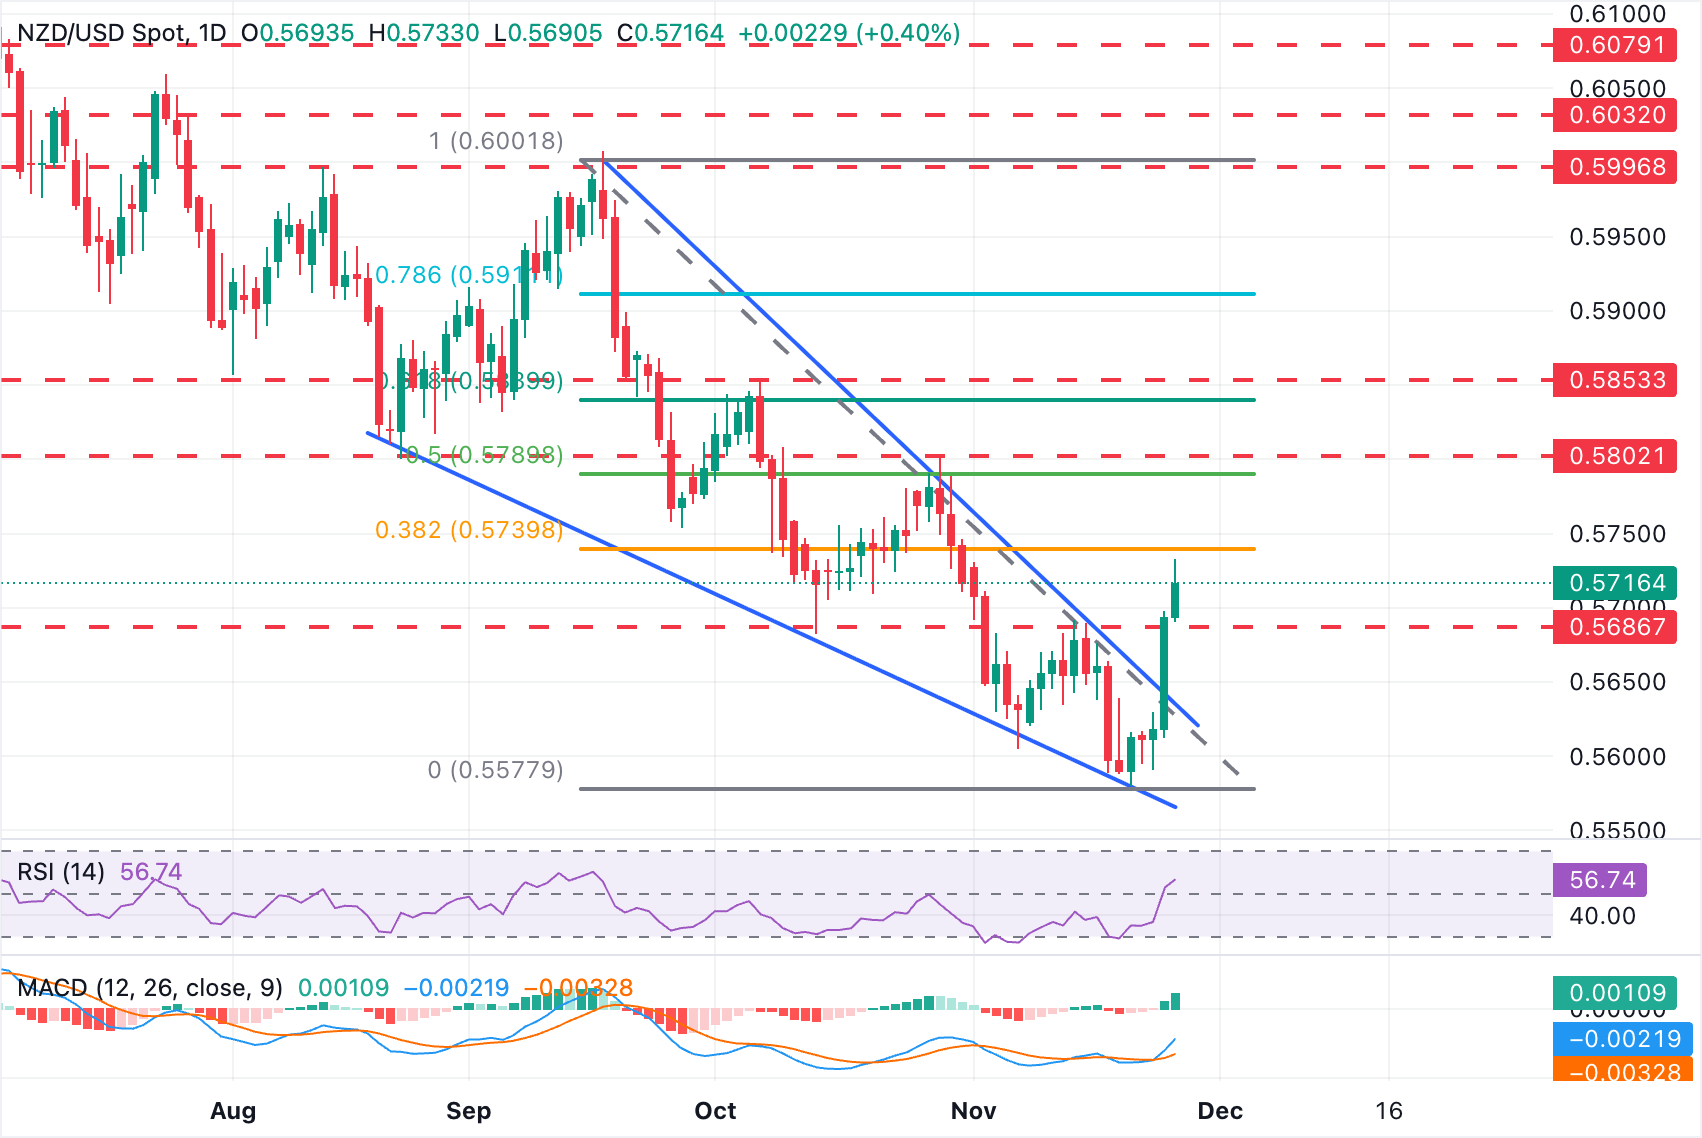
The Kiwi Dollar broke the top of a descending wedge on Wednesday and has confirmed its recovery with an extension above the November 14 and 17 highs, at 0.5680. The daily chart shows a sharp bullish crossover in the Moving Average Convergence Divergence (MACD), and the Relative Strength Index is popping up above 50, which reflects an initial bullish momentum.
Upside attempts have found some resistance at the 38.6% Fibonacci retracement of the September 15 -November 20 bearish cycle, in the area of 0.5750. Bulls, however, remain focused on the October 28 highs, just above 0.5800 and the October 7 high in the area of 0.5850.
Downside attempts remain contained above the previous 0.5680 resistance. Below here, the reverse trendline, now around 0.5625, might hold bears before last week’s multi-month lows, at 0.5580.
New Zealand Dollar FAQs
The New Zealand Dollar (NZD), also known as the Kiwi, is a well-known traded currency among investors. Its value is broadly determined by the health of the New Zealand economy and the country’s central bank policy. Still, there are some unique particularities that also can make NZD move. The performance of the Chinese economy tends to move the Kiwi because China is New Zealand’s biggest trading partner. Bad news for the Chinese economy likely means less New Zealand exports to the country, hitting the economy and thus its currency. Another factor moving NZD is dairy prices as the dairy industry is New Zealand’s main export. High dairy prices boost export income, contributing positively to the economy and thus to the NZD.
The Reserve Bank of New Zealand (RBNZ) aims to achieve and maintain an inflation rate between 1% and 3% over the medium term, with a focus to keep it near the 2% mid-point. To this end, the bank sets an appropriate level of interest rates. When inflation is too high, the RBNZ will increase interest rates to cool the economy, but the move will also make bond yields higher, increasing investors’ appeal to invest in the country and thus boosting NZD. On the contrary, lower interest rates tend to weaken NZD. The so-called rate differential, or how rates in New Zealand are or are expected to be compared to the ones set by the US Federal Reserve, can also play a key role in moving the NZD/USD pair.
Macroeconomic data releases in New Zealand are key to assess the state of the economy and can impact the New Zealand Dollar’s (NZD) valuation. A strong economy, based on high economic growth, low unemployment and high confidence is good for NZD. High economic growth attracts foreign investment and may encourage the Reserve Bank of New Zealand to increase interest rates, if this economic strength comes together with elevated inflation. Conversely, if economic data is weak, NZD is likely to depreciate.
The New Zealand Dollar (NZD) tends to strengthen during risk-on periods, or when investors perceive that broader market risks are low and are optimistic about growth. This tends to lead to a more favorable outlook for commodities and so-called ‘commodity currencies’ such as the Kiwi. Conversely, NZD tends to weaken at times of market turbulence or economic uncertainty as investors tend to sell higher-risk assets and flee to the more-stable safe havens.
Recommended Articles


